Data do not speak alone
Exercise data-dont-speak-alone-annex.pdf · PDF
Four players finish a match. The stats screen says the same thing for all four: same average, same spread, same trend. Are they the same kind of player?
You would say yes. Everybody would. And everybody would be wrong, because the stats screen is a summary, and a summary hides things. One of those four played steadily, one peaked and collapsed, one had a single freak round, and one did the same thing ten times and something completely different once. You only find out when you look.
That is the whole module in one sentence: numbers do not explain themselves. Somebody has to fetch them, clean them, and draw them so that a person can see what is going on. This year, that somebody is you.
What you will learn
- Tell data from information, and say what turns one into the other
- Explain what a summary statistic is, and why four of them were not enough for Anscombe's quartet
- Read a scatter plot and spot a curve, an outlier and a fake trend
- Name the four stages of the data lifecycle and match each one to a unit of this course
- Avoid the trap: why "data work is making charts" gets the order backwards
Data are not information
Data are raw recorded facts: a number, a word, a date. Information is what you get when somebody organises those facts to answer a question.
Take one fact: today it is 31 °C in Calvià. That is a datum (one piece of data). On its own it says very little. Hot? Normal? Compared with what?
Now watch it climb:
| Step | Example | What was added |
|---|---|---|
| Data | 31 °C in Calvià today | Nothing: a raw measurement |
| Information | The average for this month is 26 °C | Many data points, organised and compared |
| Conclusion | This month is unusually hot | A person interpreting the information |
| Decision | The air-conditioning check is moved forward | Somebody acting on the conclusion |
The data never said "move the check forward". People did, after organising the data and looking at it. That is what the title of this page means: data do not speak alone. Somebody always speaks for them, and this course teaches you to do it honestly.
Is it \"data is\" or \"data are\"?
Data is the Latin plural of datum, so careful writers say "data are". In everyday English you will also hear "data is", and nobody will misunderstand you. This page uses the plural.
Four numbers that describe a table
A table with thousands of rows does not fit in your head. So we squash it.
A summary statistic is one number that describes a whole column of data.
You already know the most famous one. Here are the four this page needs, with no formulas:
| Summary statistic | The question it answers | In a game |
|---|---|---|
| Mean (the average) | What is a typical value? | Your average score per match |
| Variance | How spread out are the values around the mean? | Do you always score about the same, or swing wildly? |
| Correlation (written r) | When one column goes up, does the other go up too? From −1 to 1; 0 means no straight-line link | Do more hours played go with a higher rank? |
| Regression line | Which straight line passes closest to all the points? | The trend: "about half a rank per extra hour" |
These four are the "stats screen" of a dataset. They are fast to compute and easy to compare. They are also a compression: many rows go in, one number comes out. And when you compress, you lose things.
How much can you lose? In 1973 a statistician decided to show it.
Anscombe's quartet
Francis "Frank" Anscombe was an English statistician who, in 1963, became the first head of the statistics department at Yale University. Computers were starting to do the calculations for people, and he was worried: analysts were printing the numbers and never drawing the picture. Many believed that calculations are exact and graphs are rough.
So in 1973 he published a short paper, Graphs in Statistical Analysis, in the journal The American Statistician. In it he built four tiny datasets, 11 points each, by hand. Today they are called Anscombe's quartet.
Here is their stats screen:
| Summary statistic | Set I | Set II | Set III | Set IV |
|---|---|---|---|---|
| Number of points | 11 | 11 | 11 | 11 |
| Mean of x | 9.00 | 9.00 | 9.00 | 9.00 |
| Mean of y | 7.50 | 7.50 | 7.50 | 7.50 |
| Variance of x | 11.00 | 11.00 | 11.00 | 11.00 |
| Variance of y | 4.13 | 4.13 | 4.12 | 4.12 |
| Correlation r | 0.816 | 0.816 | 0.816 | 0.817 |
| Regression line | y = 3.00 + 0.50x | y = 3.00 + 0.50x | y = 3.00 + 0.50x | y = 3.00 + 0.50x |
Seven rows, and the four sets agree on every one. If you only had this table, what would you conclude? That they are four copies of the same thing.
Now draw them.
A scatter plot is a chart where each row of the table becomes one dot: its x value says how far right the dot goes, its y value says how far up.
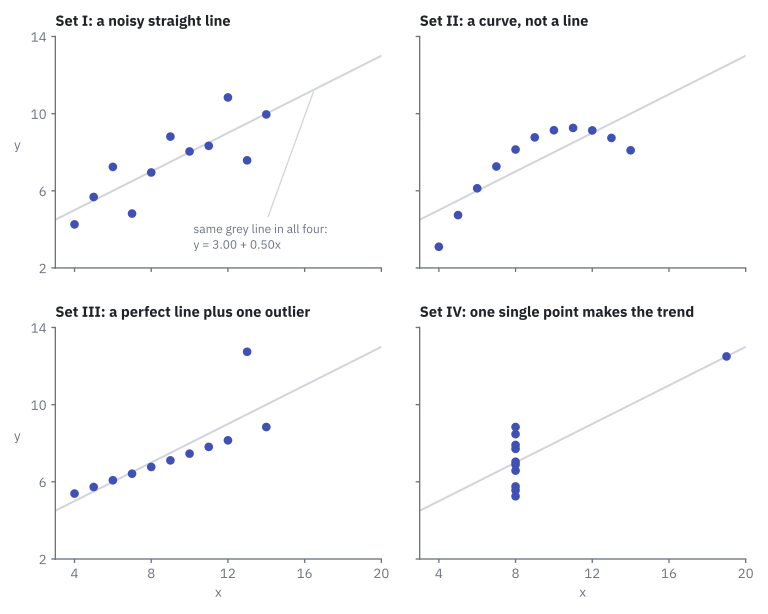
Same stats screen. Four different stories:
| Set | What the picture shows | What the numbers hid |
|---|---|---|
| I | Dots scattered around a rising line | Nothing. This is the only set the summary describes fairly. |
| II | A smooth curve that rises and then falls | The relationship is not a straight line at all. A straight-line trend is the wrong tool. |
| III | Ten dots on a perfect line, one dot far above it | One outlier (a value far away from all the others) drags the line upwards. |
| IV | Ten dots stacked at x = 8, one dot alone at x = 19 | Take away that single dot and there is no trend left. One point invented the correlation. |
The 44 points, if you want to check them yourself
Sets I, II and III share the same x values. Set IV has its own.
| x (I, II, III) | y (I) | y (II) | y (III) | x (IV) | y (IV) |
|---|---|---|---|---|---|
| 10 | 8.04 | 9.14 | 7.46 | 8 | 6.58 |
| 8 | 6.95 | 8.14 | 6.77 | 8 | 5.76 |
| 13 | 7.58 | 8.74 | 12.74 | 8 | 7.71 |
| 9 | 8.81 | 8.77 | 7.11 | 8 | 8.84 |
| 11 | 8.33 | 9.26 | 7.81 | 8 | 8.47 |
| 14 | 9.96 | 8.10 | 8.84 | 8 | 7.04 |
| 6 | 7.24 | 6.13 | 6.08 | 8 | 5.25 |
| 4 | 4.26 | 3.10 | 5.39 | 19 | 12.50 |
| 12 | 10.84 | 9.13 | 8.15 | 8 | 5.56 |
| 7 | 4.82 | 7.26 | 6.42 | 8 | 7.91 |
| 5 | 5.68 | 4.74 | 5.73 | 8 | 6.89 |
Careful: this does not mean statistics are useless
The lesson is not "ignore the numbers". The numbers are correct in all four sets. The lesson is use both: compute the summary and draw the chart. Each one catches what the other misses. That was exactly Anscombe's advice in 1973.
Was Anscombe just lucky? Meet the Datasaurus
In 2017, Justin Matejka and George Fitzmaurice, two researchers at Autodesk, pushed the idea much further. They published the Datasaurus Dozen: thirteen datasets with nearly identical summary statistics. One looks like a star. One is a circle. One is a dinosaur. Whatever the stats screen says, there can be a dinosaur behind it.
The data lifecycle: a crafting game
Anscombe gave his readers the numbers: clean, in a table, ready to plot. Real life is less generous. Before you can draw anything, you have to find the data, bring them home and fix them.
The data lifecycle is the path data follow from the place where they live to the screen where somebody reads them.
It has four stages, and you already know them if you have ever played a crafting game such as Minecraft or Stardew Valley. Nobody builds a diamond sword out of a block of stone they just looked at. We will keep this one analogy for the whole course.
flowchart LR
    O["<b>1 · Obtain</b><br>(farm and loot)"] -- "raw data" --> P["<b>2 · Prepare</b><br>(smelt, sort,<br>drop the junk)"]
    P -- "clean data" --> A["<b>3 · Analyse</b><br>(craft,<br>compare stats)"]
A -- "results" --> R["<b>4 · Represent</b><br>(the HUD and<br>the minimap)"]| Stage | In the game | With data | Where you learn it |
|---|---|---|---|
| 1 · Obtain | Farm and loot: mine ore, open chests, trade with characters | Connect to the places where data live and extract them (take out what you need): databases, files, web services | UT1, starting with Data sources |
| 2 · Prepare | Smelt the ore, sort the inventory, drop the junk | Clean: missing values, repeated rows, wrong formats | UT2, starting with Data quality |
| 3 · Analyse | Craft: combine materials, compare the stats of two items | Group, count, compute and compare: averages, totals, rankings | UT2, in Exploratory statistics |
| 4 · Represent | The HUD and the minimap: health bar, map and score at a glance | Charts and dashboards (several charts on one screen) that answer a question | UT3, starting with Visual perception, and UT4, starting with Dashboards and KPIs |
UT means work unit: a block of classes. The Learning outcomes page shows how the four units map to the three outcomes you are graded on. This page opens UT1 and frames all of them.
Where does Anscombe's quartet sit? In stage 4. The summary table was the stats screen; the scatter plots were the minimap. The minimap showed what the stats screen was hiding.
Careful: \"data work is the charts\"
It is the most common idea about this job, and it gets the order backwards. The charts are the HUD: the last thing that appears on screen. If the loot is wrong, the HUD lies, however pretty it is. Three of the four stages happen before a single chart is drawn, and stage 2 is the one beginners most want to skip. You will see why in UT2.
Every chart is an argument
Anscombe's four charts were honest. Not every chart is.
The same numbers can be drawn to whisper or to shout. Start a bar chart's vertical axis at 95 instead of 0, and a 4% rise looks like an explosion. Nothing in the data changed. Only the drawing did.
So keep three habits from day one:
- Look before you summarise. Draw the data before you trust an average.
- Treat every chart as an argument. Somebody chose what to show and how. Ask what they want you to believe.
- Let the question choose the chart. A comparison, a change over time and a relationship each need a different picture. The tool does not decide; the question does.
You will train all three properly in UT3: reading the main chart types, choosing the right one, and catching the tricks in Misleading charts.
Try it: rebuild the quartet
You need a spreadsheet program (LibreOffice Calc, Excel or Google Sheets) and the file anscombe.xlsx from the Resources page.
| Step | Do this | You should see |
|---|---|---|
| 1 | Open anscombe.xlsx. Do not draw anything yet. |
Four small tables, 11 rows each |
| 2 | For each set, compute the mean of x and of y with AVERAGE |
9 and 7.50, four times |
| 3 | Compute the variance of x and of y with VAR.S (in Calc, VAR also works) |
11 and about 4.12, four times |
| 4 | Compute the correlation with CORREL |
About 0.816, four times |
| 5 | Compute the regression line with SLOPE and INTERCEPT. Both take the y column first, then the x column. |
About 0.50 and 3.00, four times |
| 6 | Only now: insert a scatter chart for each set | Four pictures that do not look alike |
Then answer in one sentence each: what did you believe after step 5, and what do you believe after step 6?
Key takeaways
- Data are raw facts; information appears when somebody organises them to answer a question. Data do not speak alone.
- A summary statistic (mean, variance, correlation, regression line) squashes many rows into one number. It is a compression, and compression loses detail.
- Anscombe's quartet (Frank Anscombe, 1973): four datasets of 11 points with almost the same summary statistics and four completely different scatter plots.
- The pictures revealed a curve, an outlier and a trend invented by one single point. Always compute and draw.
- The data lifecycle has four stages: obtain, prepare, analyse, represent. In the crafting game: farm and loot, smelt and sort, craft, HUD and minimap.
- Charts are the last stage, not the whole job. If the earlier stages are wrong, the chart lies.
Quick check
1. What do the four datasets of Anscombe's quartet have in common?
- Exactly the same 11 points, in a different order
- Almost identical summary statistics: means, variances, correlation and regression line
- The same shape when you draw them
- Nothing: they were chosen at random
The four sets share their summary statistics (mean of x 9, mean of y 7.50, correlation about 0.816, line y = 3.00 + 0.50x), yet their points are different and so are their pictures. That gap between "same numbers" and "different pictures" is the whole point.
2. Why can two very different datasets have the same mean?
- Because the mean is often calculated wrongly
- Because the mean only works with 11 values
- Because a summary statistic squashes many values into one number, and detail is lost on the way
- Because spreadsheets round the result
A summary statistic is a compression: many rows in, one number out. Many different sets of rows can produce the same number. The mean is computed correctly in all four sets; it just cannot tell them apart.
3. In set IV, ten points have x = 8 and one point has x = 19. What happens to the trend if you delete that one point?
- Nothing changes: one point out of eleven is too few to matter
- The trend becomes a curve
- The trend disappears: that single point was creating the correlation
- The correlation rises to exactly 1
With all the remaining dots stacked at x = 8, there is nothing left for a rising line to follow. One point invented the correlation, and only the scatter plot shows it.
4. Which sequence is the data lifecycle, in order?
- Represent → obtain → prepare → analyse
- Obtain → analyse → prepare → represent
- Prepare → obtain → represent → analyse
- Obtain → prepare → analyse → represent
First you obtain the data (farm and loot), then you prepare them (smelt, sort, drop the junk), then you analyse (craft, compare stats), and only then you represent (the HUD and the minimap).
5. In the crafting-game analogy, what is the HUD and the minimap?
- Obtaining the data from its source
- Cleaning the missing and repeated values
- Representing the data with charts and dashboards
- Storing the data in a database
The HUD shows health, map and score at a glance: that is stage 4, represent. It is the last thing on screen, and it is only as good as the loot behind it.
6. A classmate says: \"Data work is basically making nice charts.\" What is the best answer?
- True: the other stages are done automatically by the tools
- Charts are the last of four stages; if the data were badly obtained or not cleaned, the chart lies
- False: charts are not part of data work at all
- True, as long as the chart has a title
Represent is stage 4 of 4. Obtaining and preparing come first, and a beautiful chart built on wrong data is still wrong. Charts matter (Anscombe proved it), but they are not the whole job.
7. A streaming app tells you two of its series have the same average rating, 7.5 out of 10. Pick the two statements that are true.
- The two series could still have very different ratings episode by episode
- The two series must have been rated by the same viewers
- A chart of the rating of every episode would show differences the average hides
- The same average proves both series are equally steady in quality
Same lesson as the quartet, new situation. An average is a summary: one series could be a steady 7.5 while the other swings between 5 and 10. Only looking at the individual values, ideally in a chart, tells them apart.
You now know why the picture matters and which four stages lead to it. Stage 1 starts with a simple question: where do data actually live? Next: Data sources.