Bar and line charts
Exercise bar-and-line-annex.pdf · PDF
The match ends and the game gives you two screens. The first is the leaderboard: every player ranked by score, the best on top. The second is the match timeline: what happened minute by minute, when the kills came, when your team collapsed.
Two screens, two different questions. Who is on top? and what happened over time? Nobody mixes them up: a leaderboard drawn as a timeline would be nonsense.
Those two screens are the two charts you will use most in your life: the bar chart and the line chart. This lesson is about building both from games_clean, and about the one question that decides which of them you need.
What you will learn
- Find your way around the Explore view of Superset and say what each of its four zones is for
- Tell a dimension from a metric, and map both to
GROUP BYand the aggregate of a SQL query - Build a ranked bar chart (a top 10) and decide what to do with a category called
Unknown - Build a line chart over time and change its time grain from year to month
- Justify bar versus line: categories have no in-between, time does
- Defuse the trap: why a line across categories invents a trend that does not exist
Dimension and metric: the two halves of every chart
In Visual perception you built your first chart, games by price band. Behind it is a query you could have written in Unit 1:
SELECT price_band, COUNT(*) FROM games_clean GROUP BY price_band;
That query has two halves, and so does every chart you will ever build.
A dimension is what you group by: the column whose values become the bars, the points or the slices.
A metric is what you compute for each group: a count, an average, a sum.
| Word | In SQL | In Superset | On the leaderboard |
|---|---|---|---|
| Dimension | The column in GROUP BY |
X-axis, Dimensions | The player names |
| Metric | The aggregate: COUNT, AVG, SUM |
Metrics | The score |
flowchart LR
    D["<b>Dimension</b><br>price_band<br>(the player names)"] --> Q["<b>GROUP BY</b> + aggregate<br>Superset writes the SQL"]
    M["<b>Metric</b><br>COUNT(*)<br>(the score)"] --> Q
    Q --> C["<b>Chart</b><br>one bar per group,<br>bar height = metric"]
Careful: dimension and metric are not Superset words
They are GROUP BY and the aggregate, the same ones you wrote in SQL Lab: groups. Superset writes that SQL for you, and you can prove it: open the chart menu (⋯, top right) and choose View query. Because you learned SQL first, you can read what the tool does and check it.
The Explore view
Every chart in Superset is built on one screen, the Explore view. Open your saved chart UT3 · Games by price band from Charts and look at it from left to right. It has four zones:
| Zone | What is there | Use it for |
|---|---|---|
| Dataset panel (left) | The columns and saved metrics of games_clean |
Dragging a column into a control |
| Data tab | Chart type, X-axis, Metrics, Dimensions, Filters, Row limit | Deciding what is computed |
| Customize tab | Titles, axis formats, orientation, legend | Deciding how it looks |
| Chart and results | The picture and, below it, the rows behind it | Checking the numbers |
The Data tab is the query. The Customize tab is the paint. Today you work almost only in Data; the paint has its own lesson, Configuring charts in Superset.
The bar chart: a leaderboard
A bar chart draws one bar per category. The length of the bar is the metric. It answers the question which category is bigger?
A bar chart is a leaderboard. The dimension is a list of categories: values with no in-between, like publishers, price bands or Pokémon types. Each one gets a bar, all bars start from the same line, and you compare where they end. That is position on a common scale, rank 1 in the Cleveland and McGill table.
Here is the leaderboard of Steam publishers: the ten that have released the most games in games_clean.
%%{init: {"themeVariables": {"xyChart": {"plotColorPalette": "#4051b5"}}}}%%
xychart-beta horizontal
    title "Top 10 publishers by number of games on Steam"
    x-axis ["Big Fish Games", "SEGA", "Strategy First", "Ubisoft", "Square Enix", "Sekai Project", "Choice of Games", "Dagestan Technology", "1C Entertainment", "THQ Nordic"]
    y-axis "Games" 0 --> 300
    bar [284, 141, 129, 123, 95, 94, 92, 89, 85, 84]
Two decisions made this chart readable, and neither is about colour:
| Decision | Why |
|---|---|
| Sorted by value | A leaderboard is a ranking. The answer to "who is first?" sits at the top |
| Horizontal bars | Long names like Dagestan Technology are readable without tilting your head |
A top 10 is not the whole table
games_clean has 13,951 different publishers. These ten hold 1,216 of the 26,685 games, under 5 %. A top 10 answers "who are the biggest?", not "who owns the market?". Remember this in Pie, heatmap and others, where the same ten publishers make a pie that lies.
The ghost player called Unknown
If you build that top 10 without thinking, the fifth bar is a publisher called Unknown, with 120 games.
Is Unknown a publisher? No. It is the label you gave to games with a missing publisher when you cleaned the data in Unit 2. On a leaderboard it is a ghost player: 120 games that belong to nobody in particular, standing in fifth place.
You have two honest options:
| Option | When |
|---|---|
| Filter it out | The question is about real publishers. Unknown is not one |
| Keep it and say so | The question is about data quality: "120 games have no known publisher" |
What you cannot do is leave it there in silence and let the reader think a company called Unknown exists.
Careful: Row limit 10 does not give ten random rows
In a bar chart, Superset orders the query by the metric, biggest first, and then cuts: you get the top ten. But the cut happens after the filter. Remove Unknown and an eleventh publisher gets in: THQ Nordic, with 84 games.
The line chart: a timeline
A line chart places one point per moment in time and joins the points with a line. It answers the question how did this change over time?
A line chart is the match timeline. Its dimension is not a list of categories. It is time, and time has two properties categories do not have: it has an order, and it is continuous. Between 2016 and 2018 there is a 2017.
That is what the line means. Joining two points tells the eye: these are connected, read the slope. Steep up, fast growth. Flat, nothing happened.
Here are the games released on Steam each year, from the column release_date:
%%{init: {"themeVariables": {"xyChart": {"plotColorPalette": "#4051b5"}}}}%%
xychart-beta
    title "Games released on Steam per year"
    x-axis ["2004", "2005", "2006", "2007", "2008", "2009", "2010", "2011", "2012", "2013", "2014", "2015", "2016", "2017", "2018"]
    y-axis "Games" 0 --> 9000
    line [53, 58, 112, 143, 183, 334, 340, 364, 426, 556, 1352, 2544, 4503, 6871, 8845]
Read the slope. Ten years of almost nothing: 53 games in 2004, 556 in 2013. Then the line takes off: 1,352 in 2014 and 8,845 in 2018.
Why does 2014 jump?
Valve, the company behind Steam, opened the store to small developers. Steam Greenlight launched on 30 August 2012 and let the community vote for the games it wanted to see in the store. On 13 June 2017 it was replaced by Steam Direct, where a developer pays a fee and publishes. A chart shows you that something changed. Finding out why is your job.
Careful: one game has no date
One game in games_clean has no release_date. The query returns a 16th row for it, with an empty year and a count of 1. It is not a point on the line: a game with no date has no place on a time axis.
Time grain: the zoom of the timeline
A date column holds days. To draw a line you must decide how to group those days: by year, by quarter, by month.
The time grain is the size of the time step on the X-axis: each point of the line adds up everything that happened inside one step.
Change the grain from year to month and the same data draw a different picture:
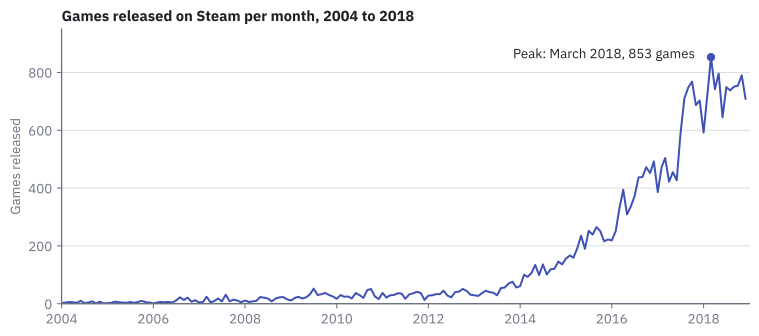
The year line said "it exploded". The month line shows when, inside each year. The highest point is March 2018, with 853 games, followed by May 2018 (796), November 2018 (790) and October 2017 (768).
| Grain | Points on the line | What you can read |
|---|---|---|
| Year | 15 | The big story: slow start, explosion after 2013 |
| Month | 180 | The detail: which months are busy, where the peak is |
Careful: the year chart and the month chart do not disagree
Same rows, same chart type, different grain. The 853 of March 2018 is part of the 8,845 of 2018. The grain is part of the question, so choose it on purpose and say it in the title: "per year", "per month".
Careful: a line that falls at the end
When a line drops at its last point, check first whether the last period is complete. If the data stop in the middle of a year, that year looks like a crash and is only an unfinished count. Here the data end on 31 December 2018, the last year is complete, and the line does not fall.
Bar or line? One question decides
The chart type follows the dimension. Ask one thing: is there something in between two neighbouring values?
flowchart TB
    Q{"What is on the X-axis?"}
    Q -- "Categories:<br>publishers, bands, types" --> B["<b>Bar chart</b><br>(the leaderboard)<br>compare heights"]
Q -- "Time:<br>days, months, years" --> L["<b>Line chart</b><br>(the timeline)<br>read the slope"]| Question | Chart | Why |
|---|---|---|
Games per owners_tier? |
Bar | Three categories. There is nothing between Mid and Hit |
| Average price per release year? | Line | Time is continuous and ordered: the slope means something |
| Games per publisher, top 10? | Bar | Ten companies. No company sits "between" two others |
What happens if you ignore the rule? Here is the publisher leaderboard drawn as a line. This chart is wrong on purpose.
%%{init: {"themeVariables": {"xyChart": {"plotColorPalette": "#4051b5"}}}}%%
xychart-beta
    title "Wrong on purpose: a line across categories"
    x-axis ["Big Fish", "SEGA", "Strategy First", "Ubisoft", "Square Enix", "Sekai Project"]
    y-axis "Games" 0 --> 300
    line [284, 141, 129, 123, 95, 94]
Your eye reads a dramatic fall and then a slow decline. A decline of what? There is no path from Big Fish Games to SEGA. Halfway between them there is no company with 212 games. The line connects things that are not connected, and the "trend" exists only because of the order somebody chose for the names.
Careful: a line does not look more professional
A line tells the eye: these points are connected, read the slope. On the timeline that is true. On the leaderboard it is a lie. Categories, bar. Time, line.
Try it: the leaderboard and the timeline
Both charts use the dataset games_clean (see Resources for the data).
Chart 2 — Top 10 publishers. Which publishers have released the most games on Steam?
| Step | Do this in Superset | You should see |
|---|---|---|
| 1 | Charts, + Chart, dataset games_clean, chart type Bar Chart, Create new chart |
An empty chart editor |
| 2 | X-axis: publisher. Metrics: COUNT(*). Row limit: 10. Create chart |
Ten bars in alphabetical order |
| 3 | X-Axis Sort By: COUNT(*). Untick X-Axis Sort Ascending. Update chart |
Tallest bar on the left. Unknown is fifth, with 120 |
| 4 | Filters: publisher, operator Not equal to (≠), value Unknown, Save. Update chart |
Ten real publishers. THQ Nordic has entered |
| 5 | Customize tab, Bar orientation: Horizontal | Names readable. The sort controls are now called Y-Axis Sort By and Y-Axis Sort Ascending |
| 6 | Save, name UT3 · Top 10 publishers |
The chart is in the Charts list |
The chart must match this query:
SELECT publisher, COUNT(*) AS n FROM games_clean
WHERE publisher <> 'Unknown'
GROUP BY publisher ORDER BY n DESC LIMIT 10;
| Publisher | Games | Publisher | Games |
|---|---|---|---|
| Big Fish Games | 284 | Sekai Project | 94 |
| SEGA | 141 | Choice of Games | 92 |
| Strategy First | 129 | Dagestan Technology | 89 |
| Ubisoft | 123 | 1C Entertainment | 85 |
| Square Enix | 95 | THQ Nordic | 84 |
Chart 3 — Games released per year. How has the number of releases changed between 2004 and 2018?
| Step | Do this in Superset | You should see |
|---|---|---|
| 1 | New chart on games_clean, chart type Line Chart |
An empty chart editor |
| 2 | X-axis: release_date. Time Grain: Year. Metrics: COUNT(*). Create chart |
One line rising to the right, from 2004 to 2018 |
| 3 | Save, name UT3 · Games released per year |
The chart is in the Charts list |
| 4 | Change Time Grain to Month. Update chart. Hover to find the highest point | A zigzag line with its peak in March 2018 |
| 5 | Save, then Save as..., name UT3 · Games released per month |
Two saved charts: the year one is not overwritten |
The line draws no dots by default: tick Customize, Marker if you want to see the 15 points. When you hover, the box rounds the value (8.85k for 2018); the exact number is in Results, under the chart.
If something looks wrong
- Time Grain is missing or greyed out. The X-axis is not a date column. Use
release_date, notrelease_year. - A bar chart with thousands of thin bars. Row limit was left at its default (10,000). Set it to 10.
- The line is a single dot.
release_datewent to Dimensions instead of X-axis. - The filter value
Unknownfinds nothing. It is case-sensitive: capital U. - Save overwrote the year chart with the month version. Set the grain back to Year and save again; then use Save as... for the month one.
Go further: another metric on the same timeline
Back on the year grain, replace the metric: Metrics, Simple tab, column price, aggregate AVG. Did games get more expensive as they got more numerous?
No. The average price peaks in 2013 at 11.21 and falls every year after that, down to 7.12 in 2018. More games, cheaper games. Keep in mind that free games count as 0 in this average.
Key takeaways
- Every chart has a dimension (what you group by, the
GROUP BYcolumn) and a metric (what you compute, the aggregate). Superset writes the SQL; View query shows it. - The Explore view has four zones: dataset panel, Data tab (what is computed), Customize tab (how it looks), chart and results.
- A bar chart compares categories: it is the leaderboard. Sort it by value, and make it horizontal when the names are long.
- A line chart shows change over time: it is the timeline. The line says "these points are connected, read the slope".
- The time grain is the zoom of the timeline. Year and month show the same rows with a different question.
- A line across categories invents a trend. A label like
Unknownis not a real category: filter it or explain it.
Quick check
1. In the query SELECT price_band, COUNT(*) FROM games_clean GROUP BY price_band, which part is the dimension?
-
COUNT(*) -
price_band -
games_clean -
SELECT
The dimension is the column you group by: its values become the bars. COUNT(*) is the metric, the number computed for each group. games_clean is the dataset.
2. Which zone of the Explore view decides what is computed?
- The dataset panel
- The Data tab
- The Customize tab
- The results table under the chart
The Data tab holds X-axis, Metrics, Filters and Row limit: it is the query. The Customize tab changes how the chart looks, and the results table only shows the rows behind the picture.
3. Why is a line chart the right choice for games released per year?
- Because lines look more professional than bars
- Because there are more than ten values
- Because time is ordered and continuous, so the slope between two points means something
- Because a bar chart cannot use a date column
A line says "these points are connected". For time that is true: between 2016 and 2018 there is a 2017, and the slope shows how fast releases grew. The number of values has nothing to do with it.
4. You change the Time Grain from Year to Month. What changes?
- The rows of the dataset: some games are dropped
- The metric: it becomes an average
- The size of the time step: each point now adds up one month instead of one year
- The chart type: it becomes a bar chart
The time grain is the zoom of the timeline. Same rows, same metric, same chart type: only the step changes. That is why the 853 games of March 2018 are part of the 8,845 of the year.
5. Your top 10 publishers chart shows Unknown in fifth place with 120 games. What is it?
- A small publisher whose name happens to be Unknown
- An error in Superset that a reload will fix
- The label given in Unit 2 to games with a missing publisher
- The sum of all publishers outside the top 10
Unknown groups 120 games without a known publisher under one label. It is not a company. Filter it out when the question is about real publishers, or keep it and say clearly what it is.
6. After you filter out Unknown with Row limit 10, the chart still has ten bars. Why?
- Superset invents a tenth publisher to fill the gap
- The limit is applied after the filter, so the eleventh publisher (THQ Nordic) moves up
- The filter did not work
- Row limit counts games, not publishers
Superset orders by the metric, biggest first, and then cuts to ten. The cut happens after the filter, so removing one row from the top lets the next one in: THQ Nordic, with 84 games.
7. Someone draws the number of Pokémon per type (water, normal, grass...) as a line chart. What is wrong?
- Nothing: any chart with numbers can be a line
- The line should be thicker
- Types are categories with nothing in between, so the line shows a trend that does not exist
- Line charts need at least 100 points
There is no path from water to normal and no type halfway between them. The slope depends only on the order somebody chose for the names. Categories, bar. Time, line.
8. You have a table of students with enrolment_date and study_programme. Pick the two correct choices.
- Enrolments per programme: Bar Chart, dimension
study_programme, metricCOUNT(*) - Enrolments month by month: Line Chart, X-axis
enrolment_datewith time grain Month, metricCOUNT(*) - Enrolments per programme: Line Chart, because programmes have an alphabetical order
- Enrolments month by month: Bar Chart with dimension
study_programme
Programmes are categories: a bar chart, no time grain. Months are time: a line chart with the grain set to Month. Alphabetical order is not a real order (there is nothing between two programmes), and study_programme says nothing about when students enrolled.
A bar per category works when the categories already exist. But what if the X-axis is a number with hundreds of different values, like a price? A bar per exact price would be unreadable. That is the job of the next chart: Histogram and scatter plot.