Configuring charts in Superset
Exercise configuring-charts-annex.pdf · PDF
You make a line chart of the games released on Steam each year. It is the right chart: evolution, a line. You paste it in the class group chat, with no message. Thirty seconds later: "What is this counting?" "Games of what?" "Which years?" "8.85k what?" "So... what am I supposed to see?"
The chart was correct and nobody could read it. Picking the right chart was the job of Choosing the right chart. Making it readable is today's job.
What you will learn
- Find your way around Superset's Explore view: what goes in the Data tab and what goes in Customize
- Tell a dimension from a metric, and use filters and the time grain to decide what is drawn
- Write a chart title that states the finding, and axis titles that say what is counted and in which unit
- Apply a number format (
,d,.1%,$,.2f) so the reader never has to count digits - Sort a chart in the order the question asks for, and decide when a legend is needed and when it is noise
- Add an annotation that gives the reader something to compare against
The screenshot test
In the crafting game of this module, a chart is part of the HUD: the health bar, the minimap, the score. Nobody pauses a match to explain what the red bar is. If the HUD needs a manual, the HUD is broken.
Your charts have the same life. A chart leaves home. Somebody takes a screenshot and pastes it in a chat, a slide, a report. You will not be there to explain it. Whatever is not written inside the picture is lost.
The screenshot test: could a stranger read this chart alone, with no caption and nobody to ask?
Here is the same chart, from the same query, before and after the test. The left one is what the tool draws on its own. The right one has had six small things changed.
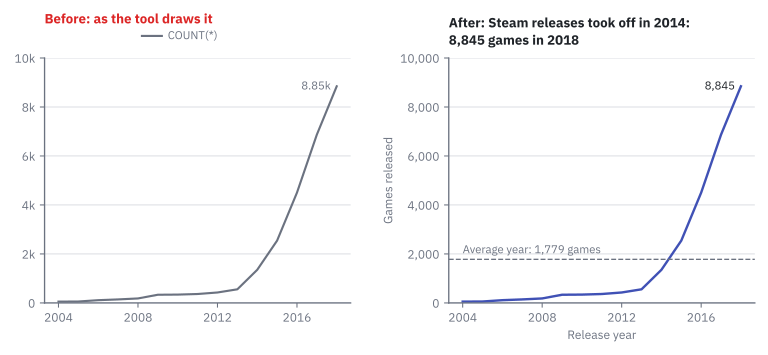
Both panels are redrawn from the class data, not screenshots. Every difference between them answers one question a stranger would ask. Those six differences are the six knobs of this lesson.
The Explore view: where everything lives
The Explore view is the screen where Superset builds one chart from one dataset. You reach it from Charts → + Chart, or by opening any saved chart.
Read it from left to right. It has four zones:
| Zone | What is there | You use it for |
|---|---|---|
| Dataset panel (left) | The columns and saved metrics of the dataset, here games_clean |
Dragging a column into a control |
| Data tab | Chart type, X-axis, Metrics, Dimensions, Filters, Row limit | Deciding what is computed |
| Customize tab | Titles, axis formats, legend, colours | Deciding how it looks |
| Chart and results | The picture and, below it, the rows behind it | Checking the numbers |
flowchart LR
    DS["<b>Dataset</b><br>games_clean:<br>columns and metrics"] --> DATA["<b>Data tab</b><br>what is computed:<br>dimension, metric,<br>filter, time grain, sort"]
    DATA -- "Superset writes<br>the SQL" --> RES["<b>Results</b><br>the rows behind<br>the chart"]
    RES --> CUS["<b>Customize tab</b><br>how it looks:<br>titles, formats,<br>legend, colours"]
    CUS --> CH["<b>The chart</b><br>(the HUD)"]
The one sentence to remember: titles and looks live in *Customize; what is counted, filters, sort and annotations live in *Data. Most people who get lost in Superset are looking in the wrong tab.
What is drawn: dimension, metric, filter, time grain
A chart is a query with a drawing on top. Take the query you have written since Unit 1:
SELECT price_band, COUNT(*) FROM games_clean GROUP BY price_band;
It has two halves, and Explore has a control for each one.
A dimension is the column you group by: the thing each bar, point or slice stands for. A metric is the aggregate computed for each group:
COUNT,AVG,SUM.
| Word | In SQL | In Explore | In the game HUD |
|---|---|---|---|
| Dimension | The column in GROUP BY |
X-axis, Dimensions | The names on the scoreboard |
| Metric | The aggregate: COUNT(*), AVG(price) |
Metrics | The score next to each name |
| Filter | The WHERE clause |
Filters | "This match only" |
| Time grain | Grouping a date by year, month, day | Time Grain | Replay by round or by minute |
| Sort | ORDER BY |
X-Axis Sort By | Who is at the top |
The time grain is the size of the time steps a date column is grouped into. The same
release_datedrawn with grain Year gives 15 points; with grain Month it gives one point per month.
This is the recipe behind the chart of the hook, the one you saved in Bar and line charts as UT3 · Games released per year:
| Step | Do this | You should see |
|---|---|---|
| 1 | Charts → + Chart. Dataset games_clean, chart type Line Chart, Create new chart. |
The Explore view, empty chart. |
| 2 | X-axis: release_date. Time Grain: Year. Metrics: COUNT(*). |
Three controls filled in the Data tab. |
| 3 | Create chart. | One line rising to the right, 2004 to 2018. |
| 4 | Chart menu (⋯, top right) → View query. | The SQL that Superset wrote for you. |
Step 4 is why Units 1 and 2 mattered: you can read what the tool does, and check it.
The six knobs
Each knob answers one question the stranger in the group chat would ask.
| Knob | The stranger asks | Where in Explore (Line Chart) |
|---|---|---|
| Title | "So what?" | Chart name at the top left of the page (Add the name of the chart) |
| Axis titles | "What is counted? In what unit?" | Customize → Chart Title → X Axis Title, Y Axis Title |
| Number format | "How many is 8.85k exactly?" | Customize → Chart Options → Y Axis → Y Axis Format |
| Sort | "Who is first?" | Data → X-Axis Sort By and X-Axis Sort Ascending (when the X-axis is a category) |
| Colour and legend | "Which line is which?" | Customize → Chart Options → Color Scheme; Legend → Show legend, Orientation |
| Annotation | "Compared to what?" | Data → Annotations and Layers → Add annotation layer |
Knob 1: a title that states the finding
Games per year is a recipe: it says what was cooked. The axis titles already do that. The title is the first thing anybody reads, so spend it on the finding: what should the reader see?
| Recipe (weak) | Finding (strong) |
|---|---|
| Games per year | Steam releases took off in 2014: 8,845 games in 2018 |
| Top 10 publishers | Big Fish Games published twice as many games as SEGA |
| owners_tier | Two out of three Steam games never reach 20,000 owners |
A quick test: a finding has a verb. And it must be true: Big Fish Games has 284 games and SEGA 141, and 284 ÷ 141 = 2.01, so "twice as many" is honest.
Knob 2: axis titles
An axis title says what is counted and in which unit: Release year, Games released. Without it, a number on the axis is just a number.
Not every axis needs one. On a bar chart of publishers, the axis with the names needs no title: SEGA and Ubisoft explain themselves. The axis with the numbers always does.
Knob 3: number formats
A number format is a short code that tells the chart how to write a number: with thousands separators, as a percentage, as money.
By default Superset uses Adaptive formatting, which shortens numbers: it is the one that writes 8,845 as 8.85k. Good for a first look, bad for a reader who wants the figure. Three formats are enough for the whole course:
| Format | Stored value | Written as | Use it for |
|---|---|---|---|
,d |
8845 | 8,845 | Counts |
.1% |
0.672 | 67.2% | Shares |
$,.2f |
12345.432 | $12,345.43 |
Money |
These codes come from a small standard language called D3 format. Superset lists ,d and $,.2f in the dropdown with an example next to each. The percentage one is listed as ,.1%; you can also type .1% and press Enter.
Careful: the format does not change the data
A format changes how the number is written, not the number. 8.85k and 8,845 are the same stored value, 8845. You are not rounding your data; you are choosing how much of it the reader gets to see.
Knob 4: sort order
Order is the first comparison the eye makes. Here are the ten biggest publishers in games_clean, twice. Same ten bars, same numbers:
%%{init: {"themeVariables": {"xyChart": {"plotColorPalette": "#4051b5"}}}}%%
xychart-beta horizontal
    title "Games published (alphabetical order)"
    x-axis ["1C Entertainment", "Big Fish Games", "Choice of Games", "Dagestan Technology", "SEGA", "Sekai Project", "Square Enix", "Strategy First", "THQ Nordic", "Ubisoft"]
    y-axis "Games published" 0 --> 300
    bar [85, 284, 92, 89, 141, 94, 95, 129, 84, 123]
Who is fourth? You have to read every bar and compare them in your head. Alphabetical order answers a question nobody asked.
%%{init: {"themeVariables": {"xyChart": {"plotColorPalette": "#4051b5"}}}}%%
xychart-beta horizontal
    title "Games published (sorted by value)"
    x-axis ["Big Fish Games", "SEGA", "Strategy First", "Ubisoft", "Square Enix", "Sekai Project", "Choice of Games", "Dagestan Technology", "1C Entertainment", "THQ Nordic"]
    y-axis "Games published" 0 --> 300
    bar [284, 141, 129, 123, 95, 94, 92, 89, 85, 84]
Who is fourth? Ubisoft. The chart did the ranking for you.
There are three honest orders. Pick the one the question asks for:
| Order | When | Example |
|---|---|---|
| By value | The question is "who has more?" | Publishers, biggest first |
| By time | The X-axis is a date | Years from 2004 to 2018, always left to right |
| Natural order | The categories have their own order | Free, Under 5, 5 to 15, 15 to 30, 30 or more |
Knob 5: colour and legend
A legend is the small key that says which colour is which series. A series is one line, or one set of bars, in the chart.
A legend answers exactly one question: "which colour is which?" So count your series first.
| Series in the chart | Legend | Why |
|---|---|---|
| One | Off | There is nothing to tell apart. The legend would only say COUNT(*), which means nothing to a stranger. Put that information in the axis title. |
| Two or more | On, at the top | It is essential, and on top it is read before the lines. |
Add owners_tier to Dimensions and the single line becomes three. Now the legend earns its place:
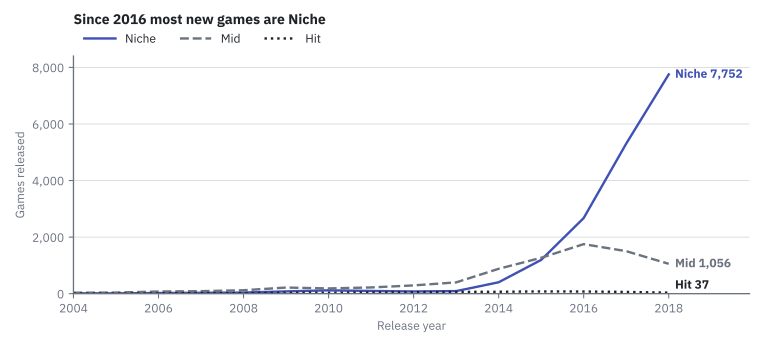
The same logic rules colour. Colour is for telling things apart. One series, one colour. Ten bars of the same thing, one colour. A Color Scheme is chosen on purpose: the one where the series are easiest to tell apart, not the one with the most colours.
Careful: 'a serious chart always has a legend'
It does not. A legend on a one-series chart is ink that tells the reader nothing, and it pushes the real content down. Serious means readable, not decorated.
Knob 6: an annotation
Is 1,352 games in a year a lot? You cannot say without something to compare against.
An annotation is a mark that you add on top of the data, a reference line or a labelled date, so the reader has something to compare with.
The simplest one is a horizontal line at the average. For the 15 years of games_clean:
SELECT ROUND(AVG(games), 1)
FROM (SELECT release_year, COUNT(*) AS games FROM games_clean
      WHERE release_year IS NOT NULL GROUP BY release_year) y;
The result is 1778.9, so the line goes at 1,779. Once it is drawn, the reader sees at a glance that only four years are above it: 2015 to 2018.
An annotation is not part of the data. Give it a name that says what it is (Average year: 1,779 games), so nobody takes it for another series.
What happened in 2017?
Annotations can also mark an event. On 6 June 2017 Valve closed Steam Greenlight, where players voted on which games could enter the store. On 13 June 2017 it opened Steam Direct: any developer could publish a game for a fee of 100 dollars. In games_clean, releases went from 4,503 in 2016 to 6,871 in 2017 and 8,845 in 2018. A date marked on the chart turns "it went up" into "it went up when the door opened".
Try it: three charts that pass the test
You need three charts saved in earlier lessons: UT3 · Games released per year and UT3 · Top 10 publishers from Bar and line charts, and UT3 · Price band by owners tier from Choosing the right chart. None of them passes the screenshot test yet.
Task 1: the line chart of games per year. Open UT3 · Games released per year from Charts.
| Step | Do this | You should see |
|---|---|---|
| 1 | Chart name (top left): write the finding, for example UT3 · Steam releases took off in 2014: 8,845 games in 2018. |
A title with a verb. |
| 2 | Customize → Chart Title: X Axis Title Release year, Y Axis Title Games released. If the title sits on top of the years, raise X Axis Title Margin from 15 to 30. |
Both axes named. |
| 3 | Customize → Chart Options: untick Show legend. Under Y Axis, Y Axis Format: ,d. |
No legend. The axis reads 8,000, not 8k. |
| 4 | Data tab → Filters → release_year → Is not null → Save. |
A filter chip. Do this before step 5. |
| 5 | Data → Annotations and Layers → Add annotation layer: Name Average year: 1,779 games, Annotation layer type Formula, Formula 1779, Style Dashed. OK, then Update chart. |
A dashed horizontal line at 1,779, with four years above it. |
| 6 | Save (overwrite). | The configured chart in your list. |
Why step 4 comes first: one game in the table has no release date. With it still in the query, the formula line starts in 1970 and squeezes your 15 years into the right edge of the chart.
Task 2: the bar chart of publishers. Open UT3 · Top 10 publishers.
| Step | Do this | You should see |
|---|---|---|
| 1 | Check the order. If the bars do not go down in steps: Data → Y-Axis Sort By COUNT(*), and tick or untick Y-Axis Sort Ascending until Big Fish Games is at the top. |
The longest bar at one end. (The bars are horizontal, so the sort controls are named after the Y axis.) |
| 2 | Customize → Chart Title: the axis with the numbers gets Axis Title Games published. |
One axis title. The names need none. |
| 3 | Customize → Chart Options: tick Show Value; untick Show legend; Axis Format ,d. |
Each bar with its number: 284 for the first, 84 for the tenth. |
| 4 | Rename to a finding: UT3 · Big Fish Games published twice as many games as SEGA. Save. |
Ten sorted bars, no legend. |
Task 3: three lines, one legend. Open the Task 1 chart again.
| Step | Do this | You should see |
|---|---|---|
| 1 | Data → Dimensions: add owners_tier. Update chart. |
Three lines instead of one. |
| 2 | Remove the annotation. | No dashed line: it was the average of the total, not of each tier. |
| 3 | Customize → Chart Options: tick Show legend, Orientation Top. Try two Color Scheme values and keep the one where the lines are easiest to tell apart. | A legend above three coloured lines. |
| 4 | Save → Save as... with the name UT3 · Since 2016 most new games are Niche. |
Niche ends highest (7,752 in 2018) and crosses above Mid in 2016. |
Optional: give the price bands their natural order
The price bands of your heatmap are in alphabetical order, 15 to 30 first. Fix it with a calculated column, as in Synthetic variables: Datasets → edit games_clean → Calculated columns → Add item, name price_band_sorted. Delete the sample text <enter SQL expression here> and type:
CASE price_band WHEN 'Free'     THEN '1 · Free'      WHEN 'Under 5'  THEN '2 · Under 5'
                WHEN '5 to 15'  THEN '3 · 5 to 15'   WHEN '15 to 30' THEN '4 · 15 to 30'
                ELSE '5 · 30 or more' END
Save → OK. Use it as X-axis in UT3 · Price band by owners tier with Sort X Axis set to Axis ascending. The columns now read 1 · Free (3,094 games), 2 · Under 5 (11,613), 3 · 5 to 15 (9,046), 4 · 15 to 30 (2,367), 5 · 30 or more (565). Alphabetical sorting is still happening; you just made the alphabet agree with you.
If something looks wrong
- The axis title does not appear or is cut: raise X Axis Title Margin / Y Axis Title Margin in the same section.
- Y Axis Format shows no
,d: type,din the box and press Enter; the list accepts typed formats. - The annotation line is not there: press Update chart. If the layer shows an error, the formula box must contain only
1779. - The X axis starts in 1970 and the line is squeezed to the right: the filter
release_yearIs not null is missing. - Save (Overwrite) is greyed out: the chart belongs to another user. Use Save as... with your own name.
When you finish, run the screenshot test for real. Leave the Task 1 chart on screen and ask a classmate three questions, without explaining anything: What is being counted? Between which years? What is the one thing I want you to see? Every wrong answer points at a knob you forgot.
Key takeaways
- The screenshot test: a chart must be readable by a stranger, alone. Whatever is not written inside the picture is lost.
- In the Explore view, the Data tab decides what is computed (dimension, metric, filter, time grain, sort, annotations) and the Customize tab decides how it looks (titles, formats, legend, colours).
- The title states the finding, with a verb. The axis titles say what is counted and in which unit.
- A number format changes how a number is written, never the number:
,dfor counts,.1%for shares,$,.2ffor money. - Sort by value, by time or by natural order. Alphabetical order answers a question nobody asked.
- A legend is for telling series apart: off with one series, on (and on top) with several. An annotation gives the reader something to compare against.
Quick check
1. What is the screenshot test?
- Checking that the chart fits on a phone screen
- Checking that a stranger could read the chart alone, with no caption and nobody to ask
- Checking that the chart loads in under one second
- Checking that the chart uses the colours of the dashboard
A chart leaves home: it gets pasted in chats, slides and reports without you. The screenshot test asks whether everything the reader needs is written inside the picture.
2. In SELECT price_band, COUNT(*) FROM games_clean GROUP BY price_band; which part is the dimension and which is the metric?
-
price_bandis the dimension;COUNT(*)is the metric -
COUNT(*)is the dimension;price_bandis the metric -
games_cleanis the dimension;price_bandis the metric - Both are metrics, because both appear after
SELECT
The dimension is the column you group by: what each bar stands for. The metric is the aggregate computed for each group. In Explore they go in X-axis / Dimensions and in Metrics.
3. Which of these is a title that states a finding?
- Games per year
- COUNT(*) by release_date
- Steam releases took off in 2014: 8,845 games in 2018
- Line chart of games_clean
The other three are recipes: they say how the chart was made, which the axis titles already do. A finding has a verb and tells the reader what to see.
4. The Y axis of your chart reads 2k, 4k, 8k and the last point says 8.85k. Which knob fixes it, and how?
- The sort: X-Axis Sort By
COUNT(*) - The legend: untick Show legend
- The number format: Y Axis Format
,d, which writes 8,845 - The time grain: change Year to Month
Adaptive formatting is the default that shortens numbers. The number format ,d writes counts in full with a thousands separator. The stored value does not change: it was always 8845.
5. Your line chart has one single line. What do you do with the legend?
- Keep it: a serious chart always has a legend
- Move it to the bottom so it takes less room
- Switch it off and say what is counted in the axis title
- Add more colours so the legend has something to show
A legend answers "which colour is which?". With one series there is nothing to tell apart: it would only repeat COUNT(*). With three series, as in the chart by owners tier, the legend becomes essential and goes on top.
6. Why add a dashed line at 1,779 to the chart of games per year?
- Because every line chart needs two lines
- Because it changes the average of the data
- Because it gives the reader something to compare each year against
- Because Superset cannot save a chart without an annotation
An annotation is something you add on top of the data to answer "compared to what?". The average of the 15 years is 1,778.9, and the line shows at a glance that only 2015 to 2018 are above it. It must be named so nobody takes it for a series.
7. A classmate's pie chart of owners tiers shows slices labelled 0.672, 0.305 and 0.023, a legend, and the title 'owners_tier'. Pick the two changes this lesson recommends.
- Apply the number format
.1%so the labels read 67.2%, 30.5% and 2.3% - Replace the title with a finding, such as "Two out of three Steam games never reach 20,000 owners"
- Sort the slices alphabetically so the legend is easier to read
- Give each slice label a different format so they stand out
Shares are written with .1%, and the title is for the finding, not for the name of a column. Alphabetical order answers a question nobody asked, and mixing formats makes numbers harder to compare, not easier.
Your charts can now explain themselves. But the same knobs that make a chart clear can make it lie: one tick on an axis and a small difference looks enormous. Next: Misleading charts, where you learn the tricks from the inside.