Visual perception
Exercise visual-perception-annex.pdf · PDF
You are in the middle of a boss fight. You do not read your health. You glance at a bar in the corner, see that it is short and red, and drink a potion. Half a second, no reading, no maths.
That corner of the screen is the HUD (heads-up display): the health bar, the minimap, the ammo counter. It works because somebody designed it for an eye that has no time. A chart has exactly the same problem. Your reader gives it a glance, and in that glance the chart either answers the question or loses them.
In Units 1 and 2 you obtained the data and cleaned it. You now own games_clean: 26,685 Steam games, tidy and trustworthy. This unit is the last stage of the data lifecycle: represent. Before drawing a single chart, you need to know how the eye reads one.
What you will learn
- Name four preattentive attributes (colour, size, position, shape) and use one to make a value pop out
- Explain why a bar is easier to read than a pie slice, with the Cleveland and McGill ranking (1984)
- Use colour to mean something, never as decoration
- Build a visual hierarchy: decide what the reader sees first
- Apply Tufte's data-ink idea (1983) and name what to erase from a cluttered chart
- Defuse the trap: why "a good chart is a pretty chart" is wrong
Count the sevens
Try this before reading on. How many sevens are in the first grid? Count them, and notice how long it takes.
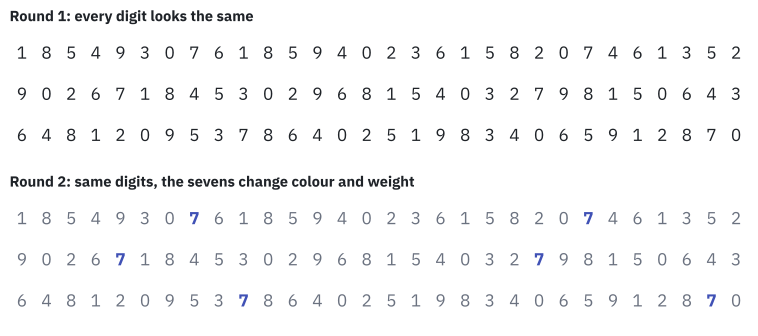
Now look at the second grid. The answer is 6, and you had it before you decided to count.
The data did not change. The digits are the same, in the same places. One visual property changed, and your eyes did the work on their own.
A preattentive attribute is a visual property that the eye detects automatically, in a single glance, before you pay conscious attention.
How fast is "a single glance"? Vision researchers use a threshold of about 200 to 250 milliseconds, a quarter of a second. That is less time than your eye needs to start moving to another spot, so whatever you detect in that window you detected without searching.
The effect has a name: pop-out. The sevens popped out of the grid.
There are many preattentive attributes. These are the four you will use all unit, each one already at work in your HUD:
| Attribute | In the HUD | In a chart |
|---|---|---|
| Colour | The enemy dot is red on a grey minimap | One highlighted bar among grey ones |
| Size / length | The health bar gets shorter | Bar length, point size |
| Position | Where the dot is on the minimap | Height of a point on an axis |
| Shape | A triangle marks the objective | Different markers for different series |
Careful: pop-out works for one thing at a time
Imagine the grid again, but with every digit in a different colour. Nothing pops out. The sevens stood out because they were the exception. Highlight everything and you have highlighted nothing.
Position beats angle
A chart turns numbers into something you can see. That translation is called an encoding: this number becomes a length, that one becomes an angle, another becomes a shade of colour.
Not all encodings are equal. Here are five Pokémon types from the class table pokemon, drawn twice. Which type has the most Pokémon? And which has the fewest?
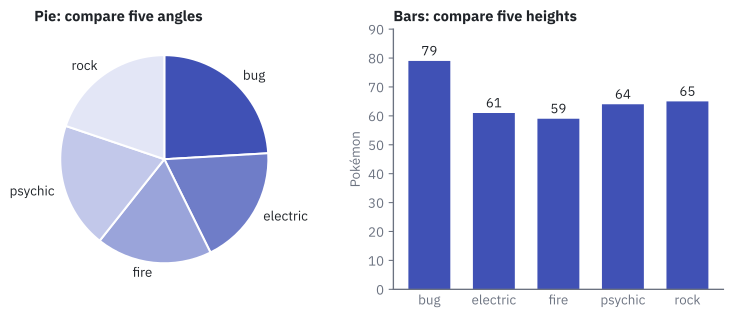
In the pie you probably found bug, and then got stuck. Is fire smaller than electric? The slices are 59 and 61, and your eye cannot tell. In the bars you see it at once, even without the numbers on top.
This is not an opinion. In 1984 two statisticians, William Cleveland and Robert McGill, published the paper Graphical Perception in the Journal of the American Statistical Association. They showed people simple graphics, asked them to judge the values, and measured the errors. Then they ranked the encodings, from the one people read most accurately to the one they read worst:
| Rank | What the eye compares | Chart that uses it |
|---|---|---|
| 1 | Position along a common scale | Bar chart, line chart, scatter plot |
| 2 | Position on non-aligned scales | Small charts side by side |
| 3 | Length, direction, angle | Stacked bars, pie slices |
| 4 | Area | Bubbles |
| 5 | Volume, curvature | 3D charts |
| 6 | Shading, colour saturation | Heatmap |
The higher in the table, the more precise the reading. Bars sit at rank 1: all of them start on the same line, so you only compare where they end. A pie asks you to compare angles, rank 3.
So the bar chart is your default answer. A pie has to earn its place, and in Pie, heatmap and others you will see exactly when it does.
Why the HUD uses a bar
Your health is a bar, not a pie and not a slightly different shade of red. The ranking explains why: the end of a bar on a fixed scale is a position, rank 1, and a shade is rank 6. In a fight you want the encoding that is read fastest and with the fewest mistakes.
Colour means something
Colour is the strongest pop-out tool you have. That is exactly why you must not waste it.
Colour has three honest jobs:
| Job | What it says | Example |
|---|---|---|
| Highlight | "Look here first" | One indigo bar among grey bars |
| Category | "These belong to different groups" | One colour per series in a line chart |
| State | "This is good, this is bad" | Green for on target, red for below |
Decoration is not a job. If every bar has a different bright colour "to make it lively", the colours say nothing, and the reader still tries to work out what they mean.
Careful: never rely on red versus green alone
About 1 in 12 men and 1 in 200 women have a colour vision deficiency, and most of them confuse red and green. If the only difference between "good" and "bad" is the colour, those readers see no difference. Add a second signal: a label, an icon, a position.
Visual hierarchy
Visual hierarchy is the order in which the eye moves through a picture: what it sees first, second and third.
In a chart the eye follows a predictable path: the title, then the biggest or most coloured mark, then the rest. You control that path.
Decide what must be seen first, and make it the biggest thing or the only coloured thing. Everything else goes quiet: grey, thin, small.
Sorting is hierarchy for free. Look at the same five bars, first in the order the database returns them and then sorted:
%%{init: {"themeVariables": {"xyChart": {"plotColorPalette": "#4051b5"}}}}%%
xychart-beta
    title "Steam games by price band"
    x-axis ["15 to 30", "30 or more", "5 to 15", "Free", "Under 5"]
    y-axis "Games" 0 --> 12000
    bar [2367, 565, 9046, 3094, 11613]
%%{init: {"themeVariables": {"xyChart": {"plotColorPalette": "#4051b5"}}}}%%
xychart-beta
title "Steam games by price band"
x-axis ["Under 5", "5 to 15", "Free", "15 to 30", "30 or more"]
y-axis "Games" 0 --> 12000
bar [11613, 9046, 3094, 2367, 565]Same data, same chart type. In the sorted version the answer to "which band is the biggest?" is the first thing on the left, and the ranking is readable without comparing bars one by one.
Careful: alphabetical order is not neutral
Alphabetical is the order nobody asked for. It puts 15 to 30 first only because the character 1 comes before F and U. Sort by value, or by the natural order of the category (cheapest to most expensive) when it has one.
Data-ink: erase what shows no data
In 1983 the American statistician Edward Tufte published The Visual Display of Quantitative Information. Its most quoted rule is five words long: "Above all else show the data."
The data-ink ratio is the share of a chart's ink that shows data. The rest is ink that could be erased without losing a single number.
Tufte gave the useless ink a name: chartjunk. The usual suspects:
| Chartjunk | Why it goes |
|---|---|
| 3D effects and shadows | They show no data, and volume is rank 5 in the Cleveland and McGill table |
| Heavy gridlines | They compete with the bars for attention |
| Background pictures | The eye reads the picture before the data |
| A legend for a single series | The title or the axis can say it |
| A different colour per bar | Colour with no meaning |
Careful: data-ink does not mean delete everything
Erase the ink that shows no data. Axis labels, units and a clear title carry meaning: they stay. A chart with no title and no labels is not minimalist, it is a riddle.
Careful: a good chart is not a pretty chart
A HUD with fireworks around the health bar gets you killed. A good chart is one where the reader finds the answer in seconds. Pretty comes after that, never instead of it.
Critique a chart in four questions
Here is a chart built from games_clean: the number of games released each year, as a pie. Look at it for a moment before reading on.
pie
    title Games per release year
    "2004" : 53
    "2005" : 58
    "2006" : 112
    "2007" : 143
    "2008" : 183
    "2009" : 334
    "2010" : 340
    "2011" : 364
    "2012" : 426
    "2013" : 556
    "2014" : 1352
    "2015" : 2544
    "2016" : 4503
    "2017" : 6871
    "2018" : 8845
Every chart you make or meet from now on gets the same four questions:
| Question | A good answer for this pie |
|---|---|
| What do I see first? Is that what matters? | A rainbow. No: the colours carry no meaning |
| What question does this chart answer? | Unclear. Probably "how did releases change over time?" |
| Which rule does it break? | Angle instead of position. Time has an order and a circle has none. Fifteen colours |
| What ink can I erase? | The legend (label the axis instead) and the colours |
Now the same 15 numbers with the rules applied: position instead of angle, years from left to right, one colour.
%%{init: {"themeVariables": {"xyChart": {"plotColorPalette": "#4051b5"}}}}%%
xychart-beta
    title "Games released on Steam per year"
    x-axis ["2004", "2005", "2006", "2007", "2008", "2009", "2010", "2011", "2012", "2013", "2014", "2015", "2016", "2017", "2018"]
    y-axis "Games" 0 --> 9000
    bar [53, 58, 112, 143, 183, 334, 340, 364, 426, 556, 1352, 2544, 4503, 6871, 8845]
What can you read now that the pie hid? The explosion after 2013: 556 games in 2013, 8,845 in 2018. The pie had that story inside it and no way of telling it.
Try it: your first chart
Time to build one. The question: how many Steam games are there in each price band? You need the table games_clean from Unit 2 (see Resources if you need the data again).
| Step | Do this in Superset | You should see |
|---|---|---|
| 1 | Charts, then + Chart. In Choose a dataset pick games_clean; in Choose chart type pick Bar Chart. Press Create new chart |
An empty chart editor |
| 2 | In the Data tab, drag price_band to X-axis. In Metrics choose COUNT(*). Press Create chart |
Five bars in alphabetical order, 15 to 30 first |
| 3 | X-Axis Sort By: choose COUNT(*). Untick X-Axis Sort Ascending. Press Update chart |
Bars from tallest to shortest |
| 4 | Save (top right). Chart name: UT3 · Games by price band. Save |
The chart appears in the Charts list |
Start every chart name of this unit with UT3 ·. In Unit 4 you will search for that prefix to build a dashboard.
The chart must show what this query returns in SQL Lab:
SELECT price_band, COUNT(*) AS n,
       ROUND(100.0 * COUNT(*) / SUM(COUNT(*)) OVER (), 1) AS pct
FROM games_clean GROUP BY price_band ORDER BY n DESC;
price_band |
Games (bar height) | Share |
|---|---|---|
Under 5 |
11,613 | 43.5 % |
5 to 15 |
9,046 | 33.9 % |
Free |
3,094 | 11.6 % |
15 to 30 |
2,367 | 8.9 % |
30 or more |
565 | 2.1 % |
When you hover over a bar, the box rounds the number (11.6k). The exact figure is in Results, under the chart.
If something looks wrong
games_cleanis not in the dataset list. The table exists but Superset has no dataset for it yet. Go to Datasets, + Dataset, choose the databaseDades classe, schemapublic, tablegames_clean, and create it. Then start again from step 1.- One single bar with 26,685.
price_bandwas not dropped on X-axis. Drag it there. - Bars in many colours with a legend. A column is sitting in Dimensions. Remove it with the ×.
Go further: change the question
Switch Metrics to AVG(price) and update the chart (do not save this version). The tallest bar is now 30 or more. The data are the same; the question changed from "how many games?" to "how expensive are they?". A chart always answers one question, so always know which one.
Key takeaways
- Preattentive attributes (colour, size, position, shape) are detected in a glance, in under about a quarter of a second. Pop-out works only when the highlighted thing is the exception.
- Cleveland and McGill (1984) ranked the encodings: position on a common scale is read most accurately; angle, area, volume and colour shading come after it. Bars are the default; a pie must earn its place.
- Colour has three honest jobs: highlight, category, state. Never decoration, and never red versus green alone.
- Visual hierarchy: decide what must be seen first and make it the biggest or the only coloured thing. Sorting bars by value is hierarchy for free.
- Data-ink ratio (Tufte, 1983): erase the chartjunk, the ink that shows no data. Titles and axis labels are not junk.
- A good chart is one where the reader finds the answer in seconds. Use the four critique questions on every chart, starting with your own.
Quick check
1. In the grid of digits, why could you count the sevens instantly the second time?
- There were fewer digits in the second grid
- Colour is a preattentive attribute: the eye detects it before conscious attention
- You had memorised where the sevens were
- Bold text is read faster than normal text by the brain's language area
The digits were identical. One visual property changed, and colour is a preattentive attribute: the visual system picks it up in a single glance, in under about 250 milliseconds. That effect is called pop-out.
2. A classmate gives each of the twelve bars of a chart a different bright colour. What happens to pop-out?
- It gets twelve times stronger
- It only works for the tallest bar
- It disappears: nothing is the exception any more
- It moves from colour to shape
Pop-out works for one thing at a time. A mark stands out because it differs from everything around it. Twelve colours are twelve things shouting, and colour used that way is decoration, which is not one of its three jobs.
3. According to Cleveland and McGill (1984), which encoding do people read most accurately?
- Angle, as in a pie slice
- Area, as in a bubble
- Colour saturation, as in a heatmap
- Position along a common scale, as in a bar chart
Position along a common scale is rank 1. Angle shares rank 3, area is rank 4 and shading or colour saturation is rank 6. That is why two bars of 59 and 61 are easy to order and two pie slices are not.
4. What is the data-ink ratio?
- The number of colours divided by the number of bars
- The share of a chart's ink that shows data
- The amount of ink a printer needs for a chart
- The ratio between the title size and the axis label size
Edward Tufte (1983): "Above all else show the data." Ink that shows no data is chartjunk (3D effects, heavy gridlines, background pictures) and can be erased. The higher the ratio, the cleaner the chart.
5. Which of these should you keep when cleaning a cluttered chart?
- The 3D shadow under each bar
- The background photo of a game controller
- The axis labels and the title
- The legend that repeats the name of the only series
Data-ink does not mean "delete everything". Axis labels, units and the title carry meaning, so they stay. The other three show no data: they are chartjunk.
6. Superset draws your bars in the order 15 to 30, 30 or more, 5 to 15, Free, Under 5. What is the problem?
- The query is wrong: some bands are missing
- Nothing: alphabetical order is the neutral choice
- It is alphabetical order, which gives the chart no hierarchy; sort by value instead
- Bar charts cannot show more than three categories
Alphabetical order is an order nobody asked for. Sorting by COUNT(*), tallest first, puts the answer where the eye lands first. That is visual hierarchy for free.
7. A dashboard shows server status with a green dot for 'OK' and a red dot for 'down', and nothing else. Why is that a risk?
- Green and red have too little contrast with a white background
- About 1 in 12 men have a colour vision deficiency, mostly red-green, and cannot tell the two states apart
- Dots are a shape, and shape is not a preattentive attribute
- State is not one of the honest jobs of colour
State is an honest job for colour, but never colour alone. About 1 in 12 men and 1 in 200 women confuse colours, mostly red and green. Add a second signal: the words "OK" and "Down", or an icon.
8. A friend shows you a chart where every bar has a different bright colour and a 3D shadow. Pick the two pieces of advice this page supports.
- Use one colour for all bars and a different one only for the bar that matters
- Remove the 3D shadow: it shows no data, and volume is read worse than position
- Turn it into a pie chart so the colours make sense
- Add a background image so the chart is easier to remember
The first is pop-out: colour works when it marks the exception. The second is Tufte (chartjunk) plus Cleveland and McGill (volume is rank 5, position is rank 1). A pie would swap position for angle, and a background image is more chartjunk.
Now you know what the eye catches in half a second. Next, the two charts you will use most, and the one question that decides between them: Bar and line charts.