Choosing the right chart
Exercise choosing-the-right-chart-annex.pdf · PDF
You have built six kinds of chart by now: bar, line, histogram, scatter, pie and heatmap. Each time, somebody told you which one to make. Now a new question lands on your desk: "Do better-rated games sell more?" Which of the six do you open?
Most people answer with the chart they like best. That is choosing a tool by its colour. In this lesson you stop choosing by taste: the question decides, and you learn to read what it is asking for.
What you will learn
- Classify any question as comparison, evolution, distribution, relationship or composition
- Name the columns a question touches and their data type: category, number or date
- Pick the chart from a decision table and justify it in one sentence
- Spot two traps: a composition with too many parts, and a question that needs no chart at all
- Build a heatmap and a scatter plot in Superset starting from a written question, with no recipe for the chart type
The block decides the tool
In the crafting game of this module, nobody mines stone with a shovel. The block in front of you decides: pickaxe for stone, axe for wood, shovel for dirt. Mining, chopping and digging are different jobs, and each job has its tool.
Charts work the same way. We keep this analogy for the whole page:
| In the game | In data work | Example |
|---|---|---|
| The block in front of you | The question somebody asks | "Which publisher has released the most games?" |
| The job (mine, chop, dig) | The type of question | Comparison |
| The material the block is made of | The columns the question touches, and their type | publisher (category) and a count (number) |
| The tool | The chart | Bar chart |
So every question gets read twice before you touch Superset:
- What kind of question is it? There are five jobs.
- Which columns does it touch, and of what type?
Get those two answers and the chart is no longer a matter of opinion.
Five jobs a question can ask for
The type of question is what the reader wants to do with the numbers: rank them, follow them in time, see how they spread, see if two of them move together, or see how a whole splits into parts.
| Job | The question sounds like | Example on games_clean |
|---|---|---|
| Comparison | "Which one has more?" "Who is first?" | Which ten publishers have released the most games? |
| Evolution | "How has it changed over time?" | How has the number of games released per year changed? |
| Distribution | "How are the values spread?" "What is typical?" | How are the prices of paid games spread? |
| Relationship | "When one goes up, does the other?" | Do games with a better Metascore reach more owners? |
| Composition | "What share of the whole is each part?" | What share of the catalogue is Niche, Mid and Hit? |
Here are the five jobs, plus a sixth panel you will meet in a moment, all drawn from the same table of 26,685 Steam games:
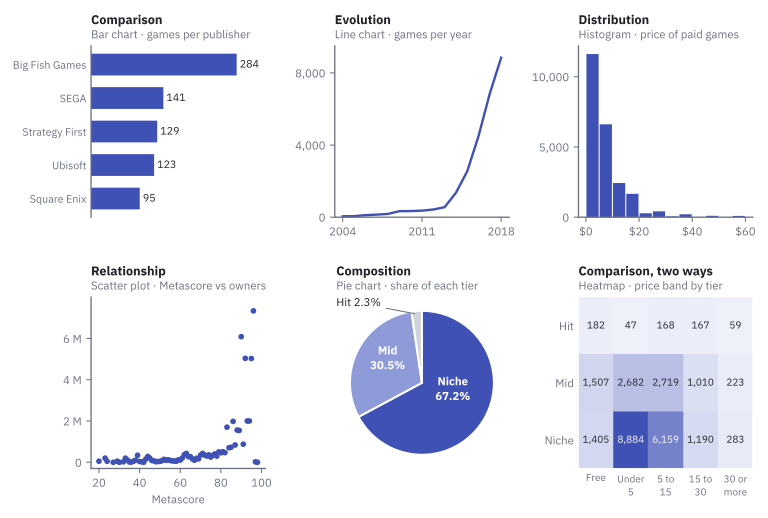
One table, six completely different pictures. None of them is "the chart of the games". Each one is the answer to a different question.
Where do these five jobs come from?
They are not a rule of this course. In 2006 Andrew Abela published a one-page diagram, Chart Suggestions: A Thought-Starter, that starts from one question, "What would you like to show?", and offers four answers: comparison, distribution, composition and relationship. We split "comparison over time" out into its own job, evolution, because it is the one you will meet most often.
Read the material: three types of column
A job is only half of the decision. A pickaxe is for mining, but you still need to know whether the block is stone or obsidian.
The data type of a column says what kind of values it holds. For choosing a chart, three types are enough: category, number and date.
| Type | What it holds | In games_clean |
In pokemon |
|---|---|---|---|
| Category | Text with a limited set of values. You can count them, not add them. | owners_tier, price_band, publisher |
type_1 |
| Number | A measured quantity. You can add it and average it. | price, metascore, owners_min |
attack, weight |
| Date | A point in time. It has an order and a distance between values. | release_date |
none |
Two columns can both be categories and still behave very differently. owners_tier has 3 values. publisher has 13,951. Keep that number in mind: it is the trap of this lesson.
Careful: a year is not just a number
release_year is stored as an integer, so it is tempting to say "year against games: two numbers, a scatter plot". But a year is a point in time: the job is evolution and the tool is a line. A scatter plot needs two measured numbers for each thing, like the price and the Metascore of one game.
The decision table
Put the two readings together and you get the table below. Keep it next to you: it is the cheat sheet for the rest of the unit.
| Job | The question sounds like | Columns it touches | Chart (name in Superset) |
|---|---|---|---|
| Comparison | "Which one has more?" | 1 category + 1 number | Bar Chart |
| Evolution | "How has it changed over time?" | 1 date + 1 number | Line Chart |
| Distribution | "How are the values spread?" | 1 number | Histogram |
| Relationship | "When one goes up, does the other?" | 2 numbers | Scatter Plot |
| Composition | "What share of the whole is each part?" | 1 category, 5 parts or fewer | Pie Chart |
| Composition, many parts | The same, with 6 parts or more | 1 category, many values | Bar Chart, sorted |
| Comparison, two ways | "Which combination has more?" | 2 categories + 1 number | Heatmap |
| No job for a chart | "How many in total?" "What exactly is the value of...?" | 1 number, or exact values | Big Number, Table |
The same table as a path you can follow with your finger:
flowchart TB
    Q["<b>The question</b><br>(the block in front of you)"] --> ONE{"Is the answer one number,<br>or a list of exact values?"}
    ONE -- "yes" --> BIG["<b>Big Number or Table</b><br>no chart needed"]
    ONE -- "no" --> JOB{"What is the job?"}
    JOB -- "who has more?" --> CMP{"How many<br>category columns?"}
    CMP -- "one" --> BAR["<b>Bar Chart</b>"]
    CMP -- "two" --> HEAT["<b>Heatmap</b>"]
    JOB -- "how did it change<br>over time?" --> LINE["<b>Line Chart</b>"]
    JOB -- "how are the<br>values spread?" --> HIST["<b>Histogram</b>"]
    JOB -- "do two numbers<br>move together?" --> SCAT["<b>Scatter Plot</b>"]
    JOB -- "what share is<br>each part?" --> PARTS{"How many parts?"}
    PARTS -- "5 or fewer" --> PIE["<b>Pie Chart</b>"]
    PARTS -- "6 or more" --> SBAR["<b>Bar Chart</b>, sorted"]
Superset sorts its charts by job too
Open Charts → + Chart and look at the Category list on the left of the chart gallery: Evolution, Distribution, Correlation, Part of a Whole, KPI... The match with our table is not perfect. Superset files the Bar Chart and the Scatter Plot under Evolution, and the Heatmap under Correlation. Trust the question, not the drawer the tool happens to sit in.
Trap 1: a whole cut into too many parts
"How is the catalogue split among publishers?" The job is composition, so your hand goes to the pie. Stop and count the parts first:
SELECT COUNT(DISTINCT publisher) FROM games_clean;
The answer is 13951. Try to cut a circle into 13,951 slices. The job is right; the material does not fit the tool.
Compare two compositions. The first has three parts and is a perfectly good pie:
pie showData
    title Steam games by owners tier
    "Niche" : 17921
    "Mid" : 8141
    "Hit" : 623
The second is how the 949 Pokémon of the class table split by primary type. Eighteen parts. As a pie it would be eighteen thin slices and a legend you read with a ruler. As a sorted bar chart you see the answer at once: water and normal lead, flying is almost empty.
%%{init: {"themeVariables": {"xyChart": {"plotColorPalette": "#4051b5"}}}}%%
xychart-beta horizontal
    title "Pokémon per primary type (18 parts: sorted bars, not a pie)"
    x-axis [water, normal, grass, bug, rock, psychic, electric, fire, ghost, dragon, dark, ground, poison, fighting, steel, ice, fairy, flying]
    y-axis "Number of Pokémon" 0 --> 130
    bar [126, 111, 84, 79, 65, 64, 61, 59, 40, 39, 37, 36, 35, 31, 30, 29, 19, 4]
The rule: with five parts or fewer, a pie. With six or more, compare the biggest parts with a sorted bar chart. For the publishers, that is exactly the top-10 bar chart you built in Bar and line charts: same columns, honest tool.
Careful: a pie is not 'the chart for percentages'
A pie is for the parts of one whole, and only a few of them. The share of free games in each year is fifteen separate percentages that do not add up to 100: that is fifteen numbers over time, so a line. Percentages alone never mean "pie".
Trap 2: a question that needs no chart
"How many games are there in the table?"
SELECT COUNT(*) FROM games_clean;
26685. One number. There is nothing to rank, nothing to follow in time, nothing to spread out. Not every block needs a diamond pickaxe.
| The reader needs | Show |
|---|---|
| One number ("how many", "how much in total") | A Big Number: the value, large, with a label |
| Exact values to look up ("what exactly is the price of...?") | A Table |
| A pattern, a ranking, a trend, a shape | A chart |
A chart is for seeing a pattern. If there is no pattern to see, a chart only slows the reader down.
Practice: eight questions, eight decisions
Before opening Superset, try these on paper. For each one write three things: the job, the columns and their type, the chart. Two of the eight are traps.
| # | Question about games_clean |
|---|---|
| 1 | How has the number of games released per year changed between 2004 and 2018? |
| 2 | Which ten publishers have released the most games? |
| 3 | How are the prices of paid games (up to 60 dollars) spread? |
| 4 | Do games with a better Metascore reach more owners? |
| 5 | What share of the catalogue is Niche, Mid and Hit? |
| 6 | Which combination of price band and owners tier holds the most games? |
| 7 | How is the catalogue split among publishers? |
| 8 | How many games are there in the table? |
Check your answers
| # | Job | Columns | Chart | What it shows |
|---|---|---|---|---|
| 1 | Evolution | release_date (date) + a count |
Line Chart | 53 games in 2004, 556 in 2013, 1,352 in 2014, 8,845 in 2018 |
| 2 | Comparison | publisher (category) + a count |
Bar Chart | Big Fish Games 284, SEGA 141, Strategy First 129, Ubisoft 123, Square Enix 95 |
| 3 | Distribution | price (number) |
Histogram | 23,508 paid games; 11,613 of them cost less than 5 dollars. A long tail to the right |
| 4 | Relationship | metascore + owners_min (2 numbers) |
Scatter Plot | Dots that drift upwards to the right |
| 5 | Composition | owners_tier (category, 3 parts) |
Pie Chart | Niche 67.2%, Mid 30.5%, Hit 2.3% |
| 6 | Comparison, two ways | price_band + owners_tier (2 categories) + a count |
Heatmap | 15 cells; the biggest is Under 5 × Niche with 8,884 games |
| 7 | Composition, many parts | publisher (category, 13,951 parts) |
Bar Chart, sorted | No pie. It is the chart of question 2 |
| 8 | No job for a chart | a count | Big Number | 26,685 |
Try it: build two of them
Questions 1 and 2 you already own from Bar and line charts. Questions 6 and 4 are new blocks: you know the tools, and now you know why to pick them. You need the games_clean dataset in Superset (the files are on the Resources page).
Question 6: price band by owners tier. Two categories and one number: a heatmap.
| Step | Do this | You should see |
|---|---|---|
| 1 | Charts → + Chart. Dataset games_clean, chart type Heatmap, Create new chart. |
The Explore view with an empty chart. |
| 2 | X-axis: price_band. Y-Axis: owners_tier. Metric: COUNT(*). |
Three controls filled in. |
| 3 | Sort X Axis and Sort Y Axis: Axis ascending. Create chart. | A grid of 5 × 3 = 15 cells. |
| 4 | Customize tab → tick Show Values; Value Format: ,d. |
A number in each cell. Without the format they read 8.88k. |
| 5 | Save → chart name UT3 · Price band by owners tier. |
The darkest cell is Under 5 × Niche with 8,884. |
Question 4: Metascore against owners. Two numbers: a scatter plot.
| Step | Do this | You should see |
|---|---|---|
| 1 | New chart on games_clean, chart type Scatter Plot. |
The Explore view. |
| 2 | X-axis: metascore. Metrics: Simple tab → column owners_min, aggregate AVG. |
One metric, AVG(owners_min). |
| 3 | Filters → metascore → operator Is not null → Save. Create chart. |
73 dots that drift upwards to the right. |
| 4 | Hover the highest dot. | Metascore 96, about 7.3 million owners on average. |
| 5 | Save → chart name UT3 · Metascore vs average owners. |
The chart in your Charts list. |
Why 73 dots and not 2,849?
Only 2,849 of the 26,685 games have a Metascore, and Superset's Scatter Plot does not draw one dot per game: it draws one dot per value of the X-axis column and needs a metric for the height. So you get one dot for each of the 73 different Metascore values, placed at the average owners of the games with that score. The dots on the far right average very few games (only three games have a 96), so they jump around. Game by game the link is weak: the correlation between Metascore and owners is only 0.14.
If something looks wrong
- The heatmap shows one cell or one row: one of X-axis / Y-Axis is empty. Both need a category column.
- The heatmap columns are in a strange order: Sort X Axis is empty, so the cells come in whatever order the database returns them. Set Axis ascending.
- The price bands read
15 to 30,30 or more,5 to 15,Free...: that is correct for now. Axis ascending sorts text alphabetically. You give the bands their natural order in the next lesson. - The scatter shows one dot:
metascorewent to Dimensions instead of X-axis. - The badge above the scatter says
74 rows: the Is not null filter is missing. The 74th group is the 23,836 games without a Metascore, which have no place on the X axis.
Key takeaways
- The question picks the chart, not your taste. Read it twice: the type of question (the job) and the data type of the columns (the material).
- Five jobs: comparison (bar), evolution (line), distribution (histogram), relationship (scatter), composition (pie).
- Three column types are enough: category, number, date. A year is a point in time, not a measured number.
- Two categories and one number is a heatmap: a comparison made two ways at once.
- A composition with six parts or more is not a pie: use a sorted bar chart.
- If the answer is one number or a list of exact values, show a Big Number or a Table. Not every question needs a chart.
Quick check
1. 'How has the average price of new games changed since 2004?' Which job is this, and which chart does it?
- Evolution: a line chart
- Comparison: a bar chart
- Distribution: a histogram
- Relationship: a scatter plot
"Changed since" means time: one date and one number. That is evolution, and its tool is the line chart. A histogram would show how prices are spread, with no time in it.
2. Before choosing a chart, which two things do you read in the question?
- The type of question, and the columns it touches with their data type
- The size of the table, and the colours of the dashboard
- The chart you made last time, and the one that looks best
- The name of the dataset, and how many filters it has
The job (comparison, evolution, distribution, relationship, composition) and the material (category, number, date). Together they point to one row of the decision table.
3. A question touches two category columns and one number: 'Which combination of price band and owners tier holds the most games?' Which chart?
- Pie chart
- Scatter plot
- Heatmap
- Histogram
Two categories make a grid and the number fills each cell: that is the heatmap, the "comparison, two ways" row. A scatter plot needs two numbers, not two categories.
4. 'How is the catalogue split among publishers?' There are 13,951 publishers. What do you draw?
- A pie chart, because the job is composition
- A sorted bar chart of the biggest publishers
- A line chart with one point per publisher
- A scatter plot of publishers against games
The job is composition, but a pie only works with five parts or fewer. With many parts you compare the biggest ones with a sorted bar chart. A line between publishers would suggest a trend from one company to the next, which means nothing.
5. Why is 'games released per year' not a scatter plot, even though release_year is stored as a number?
- Because scatter plots cannot show more than ten points
- Because Superset has no scatter plot
- Because a year is a point in time: the job is evolution, and a scatter needs two measured numbers
- Because years must always be shown in a pie
The data type that matters is what the column means, not how it is stored. A year orders the data in time, so the question is about evolution. A scatter plot is for the relationship between two measured quantities, like price and Metascore.
6. 'How many games are there in the table?' What is the right way to show the answer?
- A bar chart with one bar
- A pie chart with one slice
- A histogram
- A Big Number: 26,685
One number has no pattern to see. Show it big, with a label. A chart with a single bar adds ink and no information.
7. A streaming service asks: 'In which months of the year do people watch the most hours, and has that changed from year to year?' Pick the two statements that are true.
- The question touches two categories (month and year) and one number (hours)
- A heatmap with months on one axis and years on the other answers it
- A pie chart with one slice per month and year answers it
- It needs no chart: a Big Number is enough
Month and year are used here as two categories that cross, with hours as the number: the "comparison, two ways" row, a heatmap. A pie would have dozens of slices, and one big number cannot show a pattern across months and years. If they only asked how hours changed over time, it would be evolution: a line.
You can now pick the right tool for any block. But the right chart can still be unreadable: no titles, an axis in 2k and 4k, a legend that says COUNT(*). Next: Configuring charts in Superset, where the chart learns to explain itself.