Misleading charts
Exercise misleading-charts-annex.pdf · PDF
Look at the red chart below for two seconds, then answer without thinking: how many times better do critics rate Hit games than Niche games?
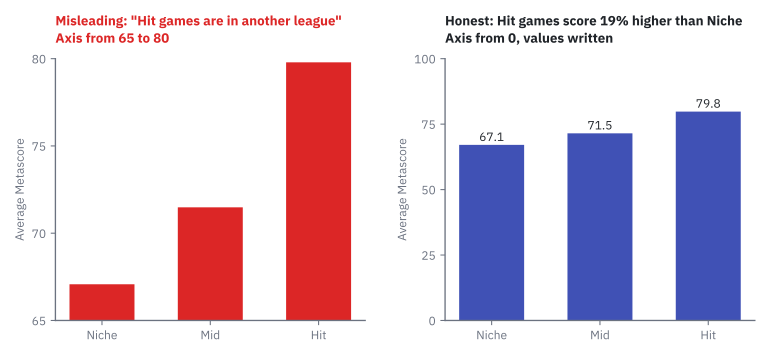
Most people say five, six, seven times. Now look at the blue chart. Same table, same query, same three numbers: 67.1, 71.5 and 79.8. Hit games score 19% higher, not 600%.
Nobody changed a number. And yet one of these two charts lies. Since Configuring charts in Superset you are the one holding the knobs, so today you learn the tricks from the inside: to catch them, and to never do them by accident.
What you will learn
- Name five ways a correct dataset becomes a misleading chart, and spot each one
- Reproduce a truncated axis and a cherry-picked range in Superset, and undo them
- Compute the lie factor of a chart and say what an honest value is
- Explain when cutting the axis is a lie (bars) and when it can be honest (lines, if you say so)
- Rewrite a misleading title as a finding the data really supports
Photo mode for data
Many video games have a photo mode. The match is the same, but with zoom, crop, angle and filter you can make a lost match look like a win. Nobody edited the match. Somebody only chose what to show.
A misleading chart is a chart in which every number is true and the picture still leads the reader to a wrong conclusion.
It is photo mode for data. We keep the analogy for the whole page: the data is the match, the chart is the photo. There are five classic tricks, and each one is a photo-mode control:
| Trick | Photo mode | How to spot it | Honest version |
|---|---|---|---|
| Truncated axis | Zoom | The bars do not start at zero. Small gaps look huge. | Bars start at zero. Always. |
| Cherry-picked range | Crop | The dates start or end exactly where it suits the headline. | Show the whole range, or say why you cut it. |
| Dual axes | Forced perspective | Two Y scales. Where the lines cross depends on the scales, not on the data. | Two charts, one above the other, same X axis. |
| 3D and crowded pies | Camera angle | Slices at the front look bigger; more than five slices cannot be compared. | Flat, five slices or fewer; otherwise sorted bars. |
| Bad colour | Filter | A rainbow on ordered values, red against green, colours that mean nothing. | One hue, darker = more. Colour only when it means something. |
Careful: 'if the numbers are true, the chart is true'
The reader does not read the numbers. They read lengths, slopes and areas. Those can lie while every number is right, which is exactly why these charts work: they would pass a fact-check number by number.
Trick 1: the truncated axis (zoom)
A truncated axis is an axis that does not start at zero, so only the top of each bar is drawn.
That is the red chart of the hook. Its Y axis runs from 65 to 80. The numbers behind it:
SELECT owners_tier, ROUND(AVG(metascore)::numeric, 1) AS avg_metascore, COUNT(metascore) AS scored
FROM games_clean GROUP BY owners_tier ORDER BY avg_metascore DESC;
| owners_tier | avg_metascore | scored |
|---|---|---|
| Hit | 79.8 | 399 |
| Mid | 71.5 | 1964 |
| Niche | 67.1 | 486 |
In a bar chart the length of the bar is the number. Cut the axis at 65 and the Hit bar is no longer 79.8 long: it is 79.8 − 65 = 14.8. The Niche bar is 67.1 − 65 = 2.1. The picture now compares 14.8 with 2.1, two numbers that exist nowhere in the data.
Measure the lie: the lie factor
In 1983 Edward Tufte, in his book The Visual Display of Quantitative Information, gave the lie a number.
Lie factor = size of the effect shown in the chart ÷ size of the effect in the data.
An honest chart has a lie factor close to 1. Tufte's limit: above 1.05 or below 0.95, the chart distorts. Do it with the two charts of the hook:
| In the data | In the truncated chart | |
|---|---|---|
| Hit compared with Niche | 79.8 ÷ 67.1 = 1.19 times | about 7 times (7.13 with the unrounded averages) |
| Size of the effect | Hit is 19% higher | The Hit bar is 613% taller |
Lie factor: 613 ÷ 19 ≈ 32. The picture shows an effect thirty-two times bigger than the one in the data. You can let PostgreSQL do the sum with the unrounded averages:
WITH t AS (SELECT AVG(metascore) FILTER (WHERE owners_tier = 'Hit')   AS hit,
                  AVG(metascore) FILTER (WHERE owners_tier = 'Niche') AS niche FROM games_clean)
SELECT ROUND((hit / niche)::numeric, 2) AS real_ratio,
       ROUND(((hit - 65) / (niche - 65))::numeric, 2) AS drawn_ratio,
       ROUND((((hit - 65) / (niche - 65) - 1) / (hit / niche - 1))::numeric, 1) AS lie_factor FROM t;
It returns 1.19, 7.13 and 32.3.
Careful: 'the Y axis must always start at zero'
In a bar chart, yes: the length of the bar is the number, so cutting the bar cuts the truth. Superset says so itself, in the ⓘ tooltip that appears when you hover the option: "It's not recommended to truncate axis in Bar chart."
In a line chart the eye reads position and slope, not length. A chart of body temperature between 35 and 42 degrees is honest, and starting it at zero would flatten the fever into nothing. So the rule is not "always zero". The rule is: never let the picture show a bigger change than the data. And if you cut an axis, label it so the reader can see the cut.
Trick 2: the cherry-picked range (crop)
A cherry-picked range is a start or end date chosen because it produces the headline, not because the question asks for it.
"Game prices in free fall", says the red chart. From 2013 to 2018 the average price of a new Steam game went from 11.21 to 7.12 dollars: a fall of 36.5%. True.
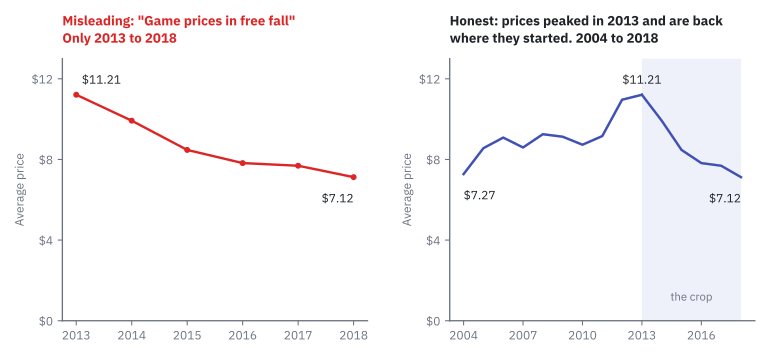
Now the whole match. The data starts in 2004, when the average was 7.27 dollars. Over the full range the change is 7.27 → 7.12: a fall of 2.1%. Prices climbed to a peak in 2013 and came back to where they started.
SELECT release_year, ROUND(AVG(price), 2) AS avg_price FROM games_clean
WHERE release_year IS NOT NULL GROUP BY release_year ORDER BY release_year;
| The photo said | The match was |
|---|---|
| −36.5% since 2013 | −2.1% since 2004, with a peak in 2013 |
The crop started at the highest point on purpose. Start anywhere else and the headline dies.
But I chose 2013 because that is where it gets interesting
Then say so, in the title or in a note: "Since the 2013 peak, prices have fallen by a third". A cut the reader can see is a decision. A cut the reader cannot see is a crop.
Trick 3: dual axes (forced perspective)
You know the tourist photo where somebody "holds up" the tower of Pisa. Two things at different distances, lined up so they seem to touch. That is forced perspective.
A chart with dual axes draws two series with two different Y scales, one on the left and one on the right.
Below, the same two series twice: games released per year on the left axis, average price on the right axis. The only difference between the panels is the range of the right-hand axis.
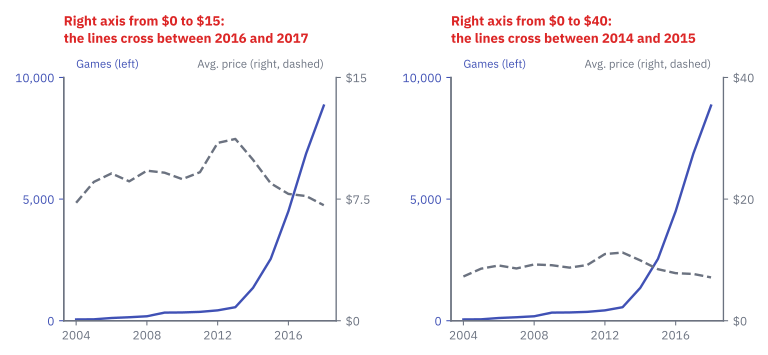
"What happened in 2016, when the two lines crossed?" Nothing happened. Stretch the right axis and the crossing moves two years back. A crossing between two different scales is made by the axis bounds, not by the data. Games and dollars cannot be bigger or smaller than each other.
The honest version costs nothing: two charts, one above the other, sharing the same X axis. The reader still compares the shapes, and no fake crossing appears.
Trick 4: 3D and crowded pies (camera angle)
A 3D pie is tilted towards you, so the slices at the front get more ink than the slices at the back for the same percentage. Superset has no 3D pie, but spreadsheets and the press are full of them. The fix is always the same: flat.
The trick you can do in Superset is the crowded pie. This is the Steam catalogue by release year, fifteen slices:
pie
    title The Steam catalogue by release year
    "2004" : 53
    "2005" : 58
    "2006" : 112
    "2007" : 143
    "2008" : 183
    "2009" : 334
    "2010" : 340
    "2011" : 364
    "2012" : 426
    "2013" : 556
    "2014" : 1352
    "2015" : 2544
    "2016" : 4503
    "2017" : 6871
    "2018" : 8845
Without looking at the numbers: what share of the catalogue was released in 2012? And in 2009? (1.6% and 1.3%. Eight of the fifteen slices are thinner than 1.5%.)
There are two mistakes in one here. Fifteen slices are far past the limit of five. And the question was never composition: years are a point in time, so the job is evolution and the tool is a line. You already have the honest chart: UT3 · Games released per year, straight from the decision table of Choosing the right chart.
Trick 5: bad colour (filter)
Colour is the filter of photo mode: it changes the mood without changing the scene. Three ways it goes wrong:
| Bad colour | Why it misleads | Honest version |
|---|---|---|
| A rainbow on ordered values (few, some, many) | Is green more than blue? The rainbow has no natural order, so the reader must learn it from the legend | One hue, from light to dark: darker = more |
| Red against green as the only difference | Some readers cannot tell them apart | A second signal: a label, a dashed line, light against dark |
| A different colour for every bar of the same thing | Colour looks like it means something, and it means nothing | One colour; a second one only for the bar that matters |
On red against green, one fact: about 1 in 12 men and 1 in 200 women have some form of colour blindness, and red-green is by far the most common kind. In a class of 25, expect one or two people for whom your red line and your green line are the same line.
Try it: build the lie, then fix it
The best way to recognise a trick is to do it once on purpose. For each case you first take the misleading photo, then name the trick, fix the chart and write the honest title. You need the games_clean dataset in Superset (see Resources).
Case A: "Hit games are in another league".
| Step | Do this | You should see |
|---|---|---|
| 1 | New chart on games_clean, chart type Bar Chart. X-axis: owners_tier. Metrics: Simple → column metascore, aggregate AVG. Create chart. |
Three bars of similar height. |
| 2 | The lie: Customize → Chart Options → Y Axis (the last block of the tab): tick Truncate Axis and set Axis Bounds to min 65, max 80. |
The chart redraws at once: Hit towers over Niche. |
| 3 | Measure on the screen, with a ruler or by counting grid lines: how many times taller is the Hit bar? Then read the two values. |
About seven times in the picture; 1.19 times in the data. |
| 4 | The fix: untick Truncate Axis, clear the bounds. Tick Show Value. Write a title the data supports. | Three bars from zero with 79.8, 71.5 and 67.1. |
| 5 | Save → UT3 · Average Metascore by owners tier. |
A title without "league" in it. |
One more honest sentence for this chart: only 486 of the 17,921 Niche games have a Metascore at all, 2.7%. The Niche bar describes a small, unusual corner of the Niche games.
Case B: "Game prices in free fall".
| Step | Do this | You should see |
|---|---|---|
| 1 | Open UT3 · Games released per year. Change the metric to AVG(price) (Simple → price, AVG). Update chart. |
A line that rises and then falls. |
| 2 | The lie: Filters → release_year → Greater or equal (>=) → 2013. Update chart. |
Six points, all downhill: −36.5%. |
| 3 | The fix: remove the filter. Y Axis Format $,.2f, axis titles, honest title. |
15 points: up to a peak in 2013 and back down. −2.1% since 2004. |
| 4 | Save → Save as... → UT3 · Average price per year. |
A new chart. Do not overwrite your chart of games per year. |
Case C: "The Steam catalogue by year".
| Step | Do this | You should see |
|---|---|---|
| 1 | New chart, chart type Pie Chart. Dimensions: release_year. Metric: COUNT(*). Create chart. |
A pie where only the biggest slices are readable. |
| 2 | Without hovering, guess the share of 2012 and of 2009. Then hover to check. | 1.6% and 1.3%. |
| 3 | The fix: build nothing. Name the saved chart that shows the same numbers honestly, and the job it does. | UT3 · Games released per year: evolution, a line. |
If something looks wrong
- Case A: the bars do not move when you set the bounds: Truncate Axis is not ticked, or you typed the bounds and did not leave the box with Tab or Enter.
- Case A: the chart is empty or the three bars are equal: the metric is
AVG(price)orCOUNT(*). It must beAVG(metascore). - Case B:
release_yearshows no ">=" operator: write the filter as custom SQL instead: Filters → Custom SQL →release_year >= 2013. - Case C: the legend has an entry
<NULL>(on its second page; the legend scrolls): that is the one game with no release date. It is real; leave it, or filterrelease_yearIs not null.
Careful: 'Superset would not let me make a wrong chart'
It let you tick Truncate Axis on a bar chart, and the only warning was a tooltip you had to hover to see. The tool draws. You answer for the picture.
Key takeaways
- A misleading chart has true numbers and a false picture. Readers read lengths, slopes and areas, not numbers.
- Truncated axis: bars must start at zero, because the length of the bar is the number. A line may zoom in, if the axis is labelled and the change shown matches the data.
- The lie factor (Tufte, 1983) is the effect shown in the chart divided by the effect in the data. Honest is close to 1; the bar chart of the hook scores 32.
- Cherry-picked range: show the whole range, or say in the title why you cut it.
- Dual axes create crossings that depend on the scales. Stack two charts instead.
- Crowded and 3D pies and bad colour hide the comparison: five slices at most, flat, and colour only when it means something.
Quick check
1. What makes a chart misleading, in the sense of this lesson?
- It contains at least one wrong number
- It was made with the wrong software
- Every number is true, but the picture leads the reader to a wrong conclusion
- It uses more than one colour
A misleading chart would pass a fact-check number by number. The lie is in what the lengths, slopes and areas make the reader believe: photo mode for data.
2. Why must the axis of a bar chart start at zero?
- Because Superset refuses to draw it otherwise
- Because the length of the bar is the number, so cutting the bar changes what is compared
- Because zero is the most common value in any dataset
- Because bars below 65 cannot be coloured
With the axis cut at 65, the Hit bar measures 14.8 and the Niche bar 2.1: the picture compares two numbers that are not in the data. Superset does let you do it; it only warns in a tooltip.
3. In the data, Hit games score 19% higher than Niche games. In the truncated chart, the Hit bar is 613% taller. What is the lie factor?
- About 0.03
- About 7
- About 32
- About 594
Lie factor = effect shown in the chart ÷ effect in the data = 613 ÷ 19 ≈ 32. An honest chart is close to 1. Seven is how many times taller the bar looks, which is not the same thing.
4. A chart titled 'Game prices in free fall' shows the average price from 2013 to 2018. The data goes back to 2004. Which trick is it?
- Truncated axis
- Cherry-picked range
- Dual axes
- Bad colour
The range starts exactly at the 2013 peak (11.21 dollars), so the fall to 7.12 looks like −36.5%. Over the whole range, from 7.27 in 2004, it is −2.1%. The honest fix is to show the full range, or to say in the title why it was cut.
5. Two lines on a dual-axis chart cross in 2016. What does the crossing tell you?
- That the two values were equal in 2016
- That one series caused the other to change
- Nothing: change the bounds of one axis and the crossing moves
- That 2016 was the peak of both series
With dual axes each line has its own scale, so where they meet is decided by the axis bounds. Games and dollars cannot be equal to each other. Stack two charts on the same X axis instead.
6. Which statement about cutting the Y axis is correct?
- It is always a lie, in every chart
- It is never a problem if the numbers are true
- It is a lie in a bar chart; in a line chart it can be honest if the axis is labelled and the change shown matches the data
- It is only allowed in pie charts
In bars the eye reads length, so the axis must start at zero. In lines the eye reads position and slope: a temperature chart from 35 to 42 degrees is honest. The real rule is never to let the picture show a bigger change than the data.
7. A bar chart compares two internet providers: A with 99.2% uptime and B with 97.5%. The Y axis goes from 97 to 100 and the title says 'A is far more reliable'. Pick the two statements that are true.
- It is a truncated axis: bar A looks more than four times taller, but 99.2 is only about 1.7% more than 97.5
- An honest version starts the bars at zero with the values written on them
- It is a cherry-picked range, because the dates were chosen on purpose
- The chart is honest, because both numbers are true
Above 97, bar A measures 2.2 and bar B 0.5: 2.2 ÷ 0.5 = 4.4 times taller in the picture, against 99.2 ÷ 97.5 = 1.017 in the data. There are no dates here, so nothing was cropped. True numbers do not make a true picture.
You can now build a chart, choose it, configure it and defend it. One chart answers one question; real decisions need several at once, side by side, on one screen. That is Unit 4: Dashboards and reports.