Pie, heatmap and others
Exercise pie-heatmap-others-annex.pdf · PDF
The match is over and the stats screen comes up. It does not show you one chart. It shows you four different things, because you have four different questions.
How did your damage split between weapons? A circle cut in slices. Where on the map did the fights happen? A map painted with colour, and the game even calls it a heatmap. What was your final score? One huge number. And who did what? The full scoreboard, a plain table.
So far you have four tools: bar, line, histogram and scatter. This lesson adds the four on that stats screen. One of them, the pie, is very easy to get wrong, so you will also build one that lies.
What you will learn
- Build a pie chart and state the three conditions under which a pie is acceptable
- Spot a pie that lies because its slices are not the whole
- Build a heatmap from two dimensions and one metric, and read a pattern from colour
- Change what a heatmap compares by normalising it
- Decide when a single big number or a plain table beats any chart
- Match eight chart types to the question each one answers
The pie chart: parts of one whole
A pie chart is a circle cut into slices. The circle is the whole, 100 %, and each slice is one part of it. It answers the question what share of the total is each part?
On the stats screen, the circle is all the damage you dealt and each slice is one weapon. The pie makes one promise that no bar chart makes: these slices add up to everything.
The idea is more than two centuries old. The Scottish engineer William Playfair is credited with the first pie chart, in his book The Statistical Breviary, published in 1801.
Here is a fair one from games_clean. In Unit 2 you created the column owners_tier, which sorts every game by how many people own it:
pie
    title Steam games by owners tier
    "Niche" : 17921
    "Mid" : 8141
    "Hit" : 623
owners_tier |
Meaning | Games | Slice |
|---|---|---|---|
Niche |
Fewer than 20,000 owners | 17,921 | 67.2 % |
Mid |
20,000 to under 1,000,000 | 8,141 | 30.5 % |
Hit |
1,000,000 or more | 623 | 2.3 % |
You can say "two out of three games are Niche" without reading a single number. That is a pie doing its job.
Three conditions, or use bars
Remember the ranking from Visual perception: the eye reads position best, and a pie makes it compare angles, two ranks lower. So a pie has to earn its place. It does when all three of these are true:
| Condition | Why | The owners tier pie |
|---|---|---|
| The slices are parts of one whole and add up to 100 % | That is the promise the circle makes | Every game is in exactly one tier |
| Few slices: five at most | Nobody can compare many angles | Three slices |
| The differences are obvious | Similar angles are impossible to rank | 67 %, 31 % and 2 % |
Fail one condition and the answer is a bar chart.
flowchart TB
    A{"Are the slices parts of<br>one whole, adding up to 100 %?"}
    A -- "No" --> BAR["<b>Bar chart</b>"]
    A -- "Yes" --> B{"Five slices or fewer?"}
    B -- "No" --> BAR
    B -- "Yes" --> C{"Are the differences obvious?"}
    C -- "No" --> BAR
    C -- "Yes" --> PIE["<b>Pie chart</b>"]
You have already met a pie that fails. The 15-slice rainbow of games per release year in Visual perception broke the second condition, and time has an order that a circle cannot show.
Careful: pies are not forbidden
You will hear people say "never use a pie". That is too strong. A pie is not wrong, it is less precise. With two or three very different slices of one whole it is fine, and everybody understands it at once. Fifteen years in a pie is not fine.
A pie that lies
Now the dangerous one. Take the same pie and put publisher in it, keeping only the ten biggest:
pie
    title Wrong on purpose - the ten biggest publishers
    "Big Fish Games" : 284
    "SEGA" : 141
    "Strategy First" : 129
    "Ubisoft" : 123
    "Unknown" : 120
    "Square Enix" : 95
    "Sekai Project" : 94
    "Choice of Games" : 92
    "Dagestan Technology" : 89
    "1C Entertainment" : 85
What share of Steam games does Big Fish Games have? The pie says about 23 %. Nearly a quarter of the store.
Check it with a query:
SELECT ROUND(100.0 * COUNT(*) FILTER (WHERE publisher = 'Big Fish Games') / COUNT(*), 2)
FROM games_clean;
The answer is 1.06. Big Fish Games published 284 of the 26,685 games: about 1 %. The pie drew 23 %.
Where does the 23 % come from? Those ten slices hold 1,252 games between them, and 284 is 22.7 % of 1,252. The pie showed the share of the rows it was given, and it was given ten publishers out of 13,951.
| Games | Big Fish Games' share | |
|---|---|---|
| The ten biggest publishers (the pie) | 1,252 | 22.7 % |
All of games_clean (the truth) |
26,685 | 1.06 % |
This pie broke the first condition: ten publishers are not the whole. It also has ten slices, and one of them is the ghost player Unknown from Bar and line charts. The honest chart for this question is the sorted bar chart you built there.
Careful: a pie does not always show percentages of the total
A pie shows percentages of the rows it was given. Cut the data with a row limit or a filter and the slices still add up to 100 %, of something smaller. The circle always looks complete. That is what makes this lie so easy to tell by accident.
The heatmap: a grid painted with colour
A heatmap is a grid. One dimension makes the columns, another makes the rows, and the colour of each cell shows a metric: the darker the cell, the higher the value.
On the stats screen, the two dimensions are the two directions of the map, and the colour is how much fighting happened in each spot. Nobody reads an exact number off it. You look for the hot zones.
That is the right way to read any heatmap. Colour shading is the last rank in the Cleveland and McGill table: the eye is bad at turning a shade into a number. But it is very good at seeing where the dark cells cluster.
A heatmap is for seeing patterns, not for reading values.
Here is the question: is there a season for releasing games on Steam? The two dimensions are the release year and the release month, and the metric is the number of games. From 2014 to 2018 that makes 5 columns × 12 rows = 60 cells, holding 24,115 games.
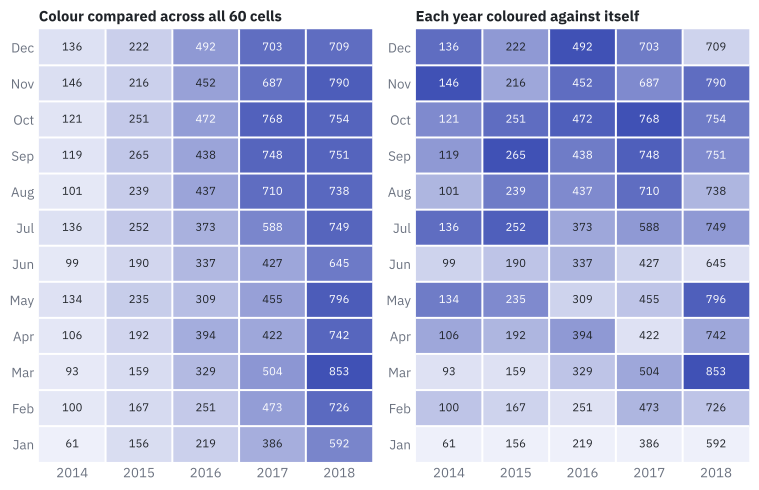
Look at the left grid first. What does the colour tell you? That 2018 is darker than 2014. The lightest cell is January 2014 (61 games) and the darkest is March 2018 (853 games).
But you knew that already. The line chart in Bar and line charts said that releases exploded. The growth from year to year is so strong that it drowns everything else, and the question about seasons is still unanswered.
Normalising: change what each colour is compared with
In the left grid, every cell is compared with all 59 others. In the right grid, each cell is compared only with the other months of its own year.
To normalise a heatmap is to change what each cell's colour is compared with: the whole grid, its own column or its own row.
Now the pattern appears. Read along the bottom row: January is the palest month in all five years. The darkest cell, the peak of each year, moves around:
| Year | Lowest month | Peak month |
|---|---|---|
| 2014 | January (61) | November (146) |
| 2015 | January (156) | September (265) |
| 2016 | January (219) | December (492) |
| 2017 | January (386) | October (768) |
| 2018 | January (592) | March (853) |
So the honest answer is: there is a clear low season, January, and no single high one. The peak falls in the second half of the year in four of the five years, and in March in 2018.
Careful: normalising does not change the data
Both grids contain the same 60 numbers: you can read them in the cells. Normalising changes only what each colour is compared with. It is the same move as changing the time grain of a line: same rows, another question.
Careful: the heatmap does not show exact values
It shows where the high and low cells are. The figure above prints the count in every cell to help you check; a real heatmap often shows only colour. When the reader needs the exact numbers, show the values in the cells or use a table.
The others: one number, one table
Not every question needs a chart with axes. Two of the most useful "charts" on a dashboard have none.
The big number
A big number is a chart that shows a single value, as large as possible.
It is the final score on the stats screen. How many games are in games_clean? There is nothing to compare, nothing to rank, no trend to read: the answer is 26,685, and the best visualisation of it is the number itself.
Think of Tufte's data-ink ratio. A big number has nothing left to erase: every drop of ink is data.
The table
A table shows rows and columns of exact values. It is the right choice when the reader needs to look things up.
It is the full scoreboard. Here are the seven games in games_clean with at least 20 million owners:
SELECT game, publisher, release_year, price, owners_min
FROM games_clean WHERE owners_min >= 20000000
ORDER BY owners_min DESC;
game |
publisher |
release_year |
price |
owners_min |
|---|---|---|---|---|
| Dota 2 | Valve | 2013 | 0.00 | 100,000,000 |
| Counter-Strike: Global Offensive | Valve | 2012 | 0.00 | 50,000,000 |
| PLAYERUNKNOWN'S BATTLEGROUNDS | PUBG Corporation | 2017 | 29.99 | 50,000,000 |
| Team Fortress 2 | Valve | 2007 | 0.00 | 50,000,000 |
| Paladins | Hi-Rez Studios | 2018 | 0.00 | 20,000,000 |
| Unturned | Smartly Dressed Games | 2017 | 0.00 | 20,000,000 |
| Warframe | Digital Extremes | 2013 | 0.00 | 20,000,000 |
Rows with the same owners_min may come out in a different order on your screen.
Read the price column. Six of the seven biggest games on Steam are free. A table lets you see that, because it shows several columns of the same row side by side. A bar chart of owners_min would have shown seven bars and hidden the most interesting fact.
Careful: a table is a visualisation too
It is tempting to think a table is what you have before you make a chart. Not always. When the reader needs the exact values of a few rows, a table is the right final answer.
The stats screen: eight tools, eight questions
That makes eight tools. Each one answers one kind of question:
| Chart | The question it answers | Built from |
|---|---|---|
| Bar | Which category is bigger? | One category and a metric |
| Line | How did it change over time? | A date and a metric |
| Histogram | How does one number spread? | One numeric column |
| Scatter | How do two numbers relate? | Two numeric columns |
| Pie | What share of one whole is each part? | One category with few values and a metric |
| Heatmap | Where is the pattern across two dimensions? | Two dimensions and a metric |
| Big number | What is the one figure to remember? | A metric alone |
| Table | What are the exact values? | Any columns, few rows |
Read the table from the middle column. You do not start with "I want a pie". You start with "what share...?" and the question picks the tool.
Try it: four charts for the stats screen
All four charts use the dataset games_clean (see Resources for the data).
Chart 6 — Owners tier share. What share of Steam games is Niche, Mid or Hit?
| Step | Do this in Superset | You should see |
|---|---|---|
| 1 | New chart on games_clean, chart type Pie Chart. Dimensions: owners_tier. Metric: COUNT(*). Create chart |
Three slices |
| 2 | Customize, Label Type: choose one that shows the percentage | Percentages on the two big slices. Hit has no label: by default only slices of 5 % or more get one (Percentage threshold) |
| 3 | Save, name UT3 · Owners tier share |
The chart is in the Charts list |
To see the lying pie for yourself, change Dimensions to publisher and Row limit to 10, and update the chart. Look at the Big Fish Games slice, then run the query above in SQL Lab. Do not save this one.
Chart 7 — Releases by month and year. Is there a season for releasing games?
games_clean has a release_year column but no month. Add it as a calculated column, as you did in Synthetic variables.
| Step | Do this in Superset | You should see |
|---|---|---|
| 1 | Datasets, games_clean, edit (the pencil), Calculated columns, Add item. Name it release_month |
A new row with an expression box |
| 2 | The SQL expression box comes with the sample text <enter SQL expression here>. Select it all, delete it, and type the expression below. Save, then OK in Confirm save |
The dataset has a new column |
| 3 | New chart on games_clean, chart type Heatmap. X-axis: release_year. Y-Axis: release_month. Metric: COUNT(*) |
The three controls filled in |
| 4 | Filters: release_year, Greater or equal (>=), 2014, Save. Sort X Axis and Sort Y Axis: Axis ascending. Create chart |
A grid of 5 columns × 12 rows, darkest towards 2018. Month 1 is the bottom row |
| 5 | Set Normalize Across to x. Update chart. Then Customize, tick Normalized | Each year coloured against itself. The bottom row is the palest in every column |
| 6 | Save, name UT3 · Releases by month and year |
The chart is in the Charts list |
EXTRACT(MONTH FROM release_date)::int
Chart 8 — Total games. New chart, chart type Big Number, Metric: COUNT(*). It shows 26.7k. In Customize, set Number format to ,d to get the exact figure, 26,685. Save it as UT3 · Total games.
Chart 9 — Biggest games table. New chart, chart type Table. Query mode: Raw records. Columns: game, publisher, release_year, price, owners_min. Filters: owners_min, Greater or equal (>=), 20000000. Ordering: owners_min [desc]. You should see seven rows, Dota 2 first. Save it as UT3 · Biggest games table.
If something looks wrong
- The heatmap gives a database error as soon as
release_monthis used. The sample text<enter SQL expression here>is probably still in front of your expression. Edit the dataset, open the column with the + at its left, and delete it. release_monthis not in the dataset panel. The dataset edit was not saved, or the chart was opened before it. Reload the chart page.- Heatmap months in the order 1, 10, 11, 12, 2. The column is text. The expression must end in
::int. - A pie with a hundred thin slices.
publisherwith Row limit at its default (100 in the Pie Chart). Set it to 10. - The table shows 1,000 rows. The filter on
owners_minis missing, or one zero is missing in20000000.
Key takeaways
- A pie chart shows parts of one whole. It is acceptable only when the slices add up to 100 % of something real, there are five or fewer, and the differences are obvious. Otherwise, bars.
- A pie shows shares of the rows it was given. With a row limit or a filter it still looks complete: Big Fish Games has 1.06 % of the games, and a top 10 pie draws 22.7 %.
- A heatmap is a grid of two dimensions with a metric as colour. It is for seeing patterns, not for reading values.
- Normalising a heatmap changes what each colour is compared with. The data stay the same; the question changes.
- A big number shows one figure to remember. A table shows exact values to look up, and can reveal what a chart hides.
- Start from the question, never from the chart: eight tools, eight kinds of question.
Quick check
1. Which of these is one of the three conditions for an acceptable pie chart?
- The slices must be sorted alphabetically
- Every slice must have a different bright colour
- The slices are parts of one whole and add up to 100 %
- There must be at least ten slices
The three conditions: parts of one whole, few slices (five at most) and obvious differences. Fail one and the right chart is a bar chart, because the eye compares positions better than angles.
2. The owners tier pie has slices of 67.2 %, 30.5 % and 2.3 %. Why is it a fair pie?
- Because pies are always the best chart for percentages
- Every game is in exactly one tier, there are only three slices, and the differences are obvious
- Because it uses three colours
- Because the smallest slice is under 5 %
It meets all three conditions: the tiers cover the whole table, three slices are few, and nobody needs to squint to rank 67 %, 31 % and 2 %.
3. A pie of the ten biggest publishers shows Big Fish Games at about 23 %. Its real share of all games is 1.06 %. What went wrong?
- The query that counts the games has a bug
- Superset rounds percentages up
- The pie shows shares of the rows it was given: ten publishers out of 13,951 are not the whole
- Pies cannot show values under 5 %
A pie's slices always add up to 100 % of what is inside it. Limit it to ten rows and 284 games become 22.7 % of 1,252 instead of 1.06 % of 26,685. The circle looks complete either way.
4. What is a heatmap good for?
- Reading exact values quickly
- Showing parts of one whole
- Seeing where the high and low values cluster across two dimensions
- Showing the distribution of one numeric column
A heatmap encodes the metric as colour, which the eye reads imprecisely. Its strength is patterns: the hot and cold zones of a grid. Exact values belong in a table; one numeric column belongs in a histogram.
5. In the first heatmap of releases by month and year, the 2018 column is the darkest. Why does that not answer \"is there a season for releases?\"
- Because the colours are wrong
- Because 2018 has missing months
- Because every cell is compared with all the others, so the growth from year to year hides the differences between months
- Because heatmaps cannot use dates
With colour compared across all 60 cells, the picture only repeats what the line chart said: more games every year. Normalising by year colours each year against itself, and then the pale January row appears.
6. What changes when you normalise a heatmap?
- The counts in the cells
- The number of rows and columns
- What each cell's colour is compared with
- The chart type
The 60 numbers are identical before and after. Only the comparison changes: the whole grid, or the cell's own column. Same data, another question.
7. You need to show the seven biggest games with their publisher, year, price and owners. Which tool fits best?
- A pie chart with seven slices
- A heatmap
- A table
- A big number
The reader needs to look up exact values in several columns of a few rows: that is a table. It also reveals that six of the seven are free, which a chart of one column would hide.
8. A shop wants four things on its dashboard. Pick the two correct choices.
- The share of online versus in-store sales: a pie, because they are two parts of one whole
- Which weekday and hour has the most sales: a heatmap of weekday × hour, coloured by sales
- Sales split between its 40 product categories: a pie with 40 slices
- This month's total revenue on the screen by the door: a scatter plot
Two parts of one whole with an obvious difference is the best case for a pie. Two dimensions and a metric is a heatmap. Forty slices break the "few slices" condition (use a sorted bar chart), and one figure to remember is a big number.
You now own eight tools and you know the question each one answers. The next step is the hard one: getting a question with no hint about which tool to pick. That is Choosing the right chart.